Climate Change & Energy

The science is clear. The risks posed by climate change to human health and our planet’s future require immediate action. Through our projects and programs, we are working to do our part to tackle climate change and reduce our campus’ greenhouse gas (GHG) emissions.
Approximately half of the energy used on campus in 2023 was from low carbon or no carbon sources such as nuclear, wind, solar and hydro. Of the 434,868 GJ of energy used by TMU in 2023, 215,987 GJ (49.7%) is estimated to have come from clean energy sources.
Annual GHG emissions tracking
Each year Toronto Metropolitan University completes a greenhouse gas (GHG) emissions inventory to measure our carbon footprint and track Scope 1, 2, and 3 emissions.
Scope 1
Scope 1 emissions are those produced directly by sources owned or controlled by an organization (natural gas boilers and diesel generators).
Scope 2
Scope 2 emissions are those produced indirectly by products or services purchased by an organization (electricity and district steam).
Scope 3
Scope 3 emissions are all other indirect emissions produced as a result of an organization's activities and operations (waste, commuting and business travel).
GHG emissions inventory 2010-2023

This bar graph shows TMU's greenhouse gas (GHG) emissions inventory from 2010 to 2023 measured in tCO2e (tonnes of carbon dioxide equivalent).
Energy intensity (energy consumption per square metre of building space), shown in the figure below, has remained relatively constant over the last 10 years with the exception of the reduction seen in the last two years as result of the campus COVID-19 shutdown.
Energy intensity 2010-2023

This bar graph shows TMU's energy intensity from 2010 to 2022 measured in GJ/m2 (gigajoules per square metre).
| Fiscal Year | Energy Intensity (GJ/m2) |
|---|---|
| 2010/2011 | 1.23 |
| 2011/2012 | 1.13 |
| 2012/2013 | 1.23 |
| 2013/2014 | 1.19 |
| 2014/2015 | 1.28 |
| 2015/2016 | 1.22 |
| 2016/2017 | 1.17 |
| 2017/2018 | 1.26 |
| 2018/2019 | 1.30 |
| 2019/2020 | 1.10 |
| 2020/2021 | 0.96 |
| 2021/2022 | 1.06 |
| 2022/2023 | 1.08 |
Climate and Energy Working Group
The Sustainability Office established a Climate and Energy Working Group composed of staff, students and faculty. The goals of the working group are to develop institutional GHG emission reduction targets and a plan to achieve the recommended targets.
Green Will Initiative
In April 2020, TMU joined the Green Will Initiative (external link) (GWI), a voluntary program of the City of Toronto that seeks to accelerate GHG emissions reduction in buildings across Toronto to achieve net-zero. Through its participation in the GWI, TMU has committed to working with the City to develop Pathway to Net Zero Plans that include establishing goals and actions to reduce the carbon footprint of its buildings.
Energy and emissions reduction projects
The university has taken many steps to improve the sustainability performance of existing buildings through the implementation of carbon and energy reduction projects. This includes campus-wide lighting retrofits, upgrading heating and cooling systems and constructing LEED certified, state-of-the-art facilities. We are continuing to plan and implement projects that are focused on improving the energy efficiency of our buildings and reducing the carbon footprint of our campus.

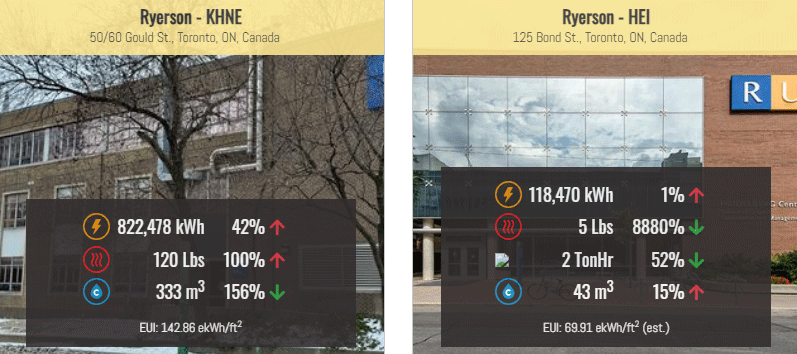
Sub-meters are installed in 28 buildings on campus to track electricity, natural gas, district steam, district chilled water, and domestic water use. The data collected helps to support decisions regarding energy efficiency and GHG emissions reduction projects and initiatives and enables us to measure and verify projects that have been completed. Additionally, the building level data supports Campus as a Living Lab projects and programs through its use in faculty research and student projects related to building energy and GHG emissions profiles.
The process of retro-commissioning existing buildings is a multistage process that can result in significant energy efficiency improvements and reduce a building’s carbon footprint. It involves:
- in-depth analysis of a building’s actual energy use and performance
- adjusting the building’s automation control system
- if needed, implementing equipment upgrades
Over the past few years, Victoria Building (VIC), George Vari Engineering and Computing Centre (ENG), Mattamy Athletic Centre (MAC), the Library Chiller Plant and SLC have all undergone retro-commissioning. The work completed in MAC, VIC and ENG resulted in approximately 152 tonnes of CO2 reduced.
A significant reduction in energy consumption can be achieved by upgrading existing fluorescent lighting systems to LEDs. Upgrades have been conducted in several buildings on campus including Eric Palin Hall. Retrofits are conducted on an ongoing basis, and any new buildings or renovations are required to have high-efficiency lighting installed. Several buildings on campus also have occupancy sensors, which automatically turn off lights when no one is using the space.
TMU’s maintenance and operations and sustainability teams work hand in hand to execute a Demand Response plan that helps reduce the IESO electrical grid demand, which turns into financial savings for the university and a reduction of Carbon Emission on the electrical grid.
Optimal operation of steam traps is crucial for a campus like TMU, which makes use of district steam for most of its heating requirements. Malfunctioning steam traps can result in significant amounts of wasted energy due to steam leaks. This often leads to comfort issues within buildings as well. The results of the annual steam trap audit were used to identify steam traps in need of maintenance or replacement to avoid increased consumption of steam.
An array of 40 solar photovoltaic (PV) panels was installed on the roof of the SCC building in 2011. Electricity produced by the solar panels is sold back to the Ontario electricity grid as part of the MicroGrid Program, contributing to an increase in the use of renewable energy on the electricity grid. Annually, the solar panels produce approximately 10,000 kWh of electricity.
Energy conservation and demand management plan
An updated Energy Conservation and Demand Management Plan was published in 2019 to help guide TMU’s efforts to reduce campus energy consumption, operating costs and greenhouse gas emissions. The plan also fulfils the Ontario Regulation 507/18 (external link) reporting requirement.
Participation in Earth Hour
TMU is pleased to participate in Earth Hour (external link) , an initiative that shines a light on climate action and symbolizes a collective commitment to address climate change. Facilities Management and Development turns off all non-essential lighting in and around university campus buildings during Earth Hour each year.
Additional TMU initiatives
Featured below are some initiatives from groups across campus working to advance sustainable energy solutions at the university.
Centre for Urban Energy
A research innovation centre dedicated to solving urban energy challenges by bringing together industry and government partners with top researchers
Clean Energy Zone
An incubator focused on clean, sustainable energy innovations including electric vehicles, renewable energy, energy storage and distribution, microgrids and net-zero city building.