Graduate Students
The data in this section provides details about the representation of graduate students from six equity-deserving groups: women, racialized people, First Nations, Inuit and Métis Peoples, Black people, persons with disabilities and 2SLGBTQ+ people. Programs are organized by faculty.
Explore the data
In addition to viewing the charts, data can also be downloaded and converted to an MS Excel or CSV file. There is a download bar at the bottom of the chart. When you click on the download bar, select the format from the download options.
The following data is provided in bar chart format. The charts have perpendicular lines. The horizontal line is called the X-axis and the vertical line is called the Y-axis.
Using the data
By collecting this data, we empower our faculties with information that they can use to identify and target equity-deserving groups in graduate studies. As an example, the Yeates School of Graduate and Postdoctoral Studies used the graduate student data to identify opportunities for additional equity-deserving group-specific funding, recognizing that higher cost is a factor in the lower representation of some equity-deserving groups in graduate studies compared to undergraduate studies.
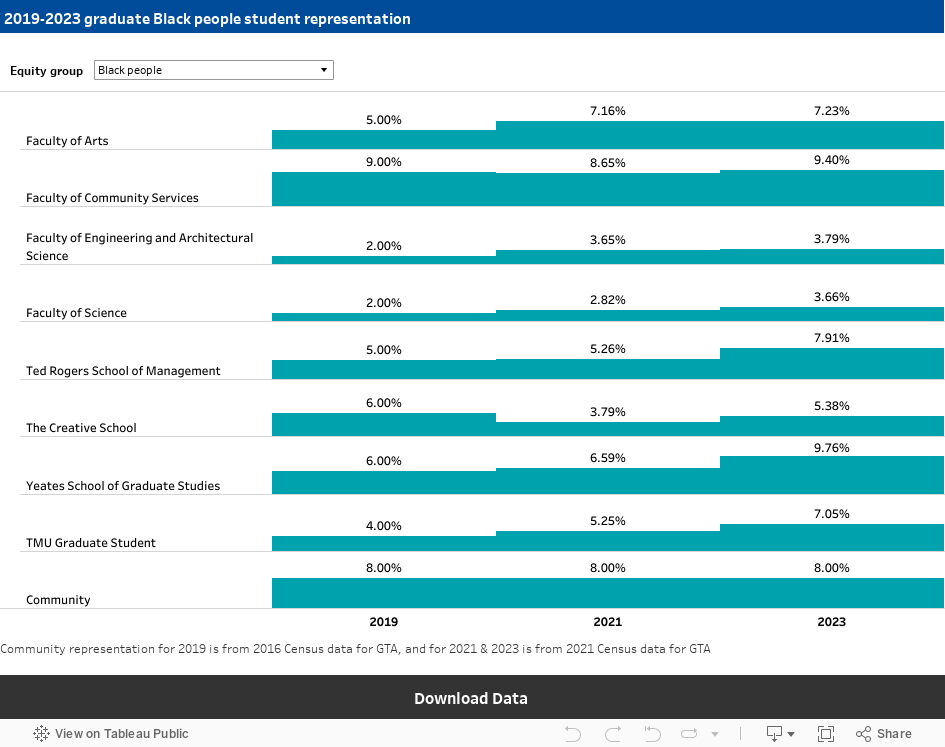
Changes in program representation over time by faculty
Here are some notes to help navigate the visual representations:
- Since graduate programs often have a relatively small number of students, changes over time are shown combined for each faculty and not by program.
- The equity group can be selected from the drop down menu.
- The Y-axis in the chart (vertical axis) lists the faculties, and the percentage of student representation in the programs is shown on the X-axis (horizontal axis) for each year.
- The bars extend to the percentage representation of the equity group named in the title, in each faculty for each year..
- There are also bars showing the representation of the selected equity group in the TMU graduate student population as a whole and in the community.
Hovering over a bar shows the details.
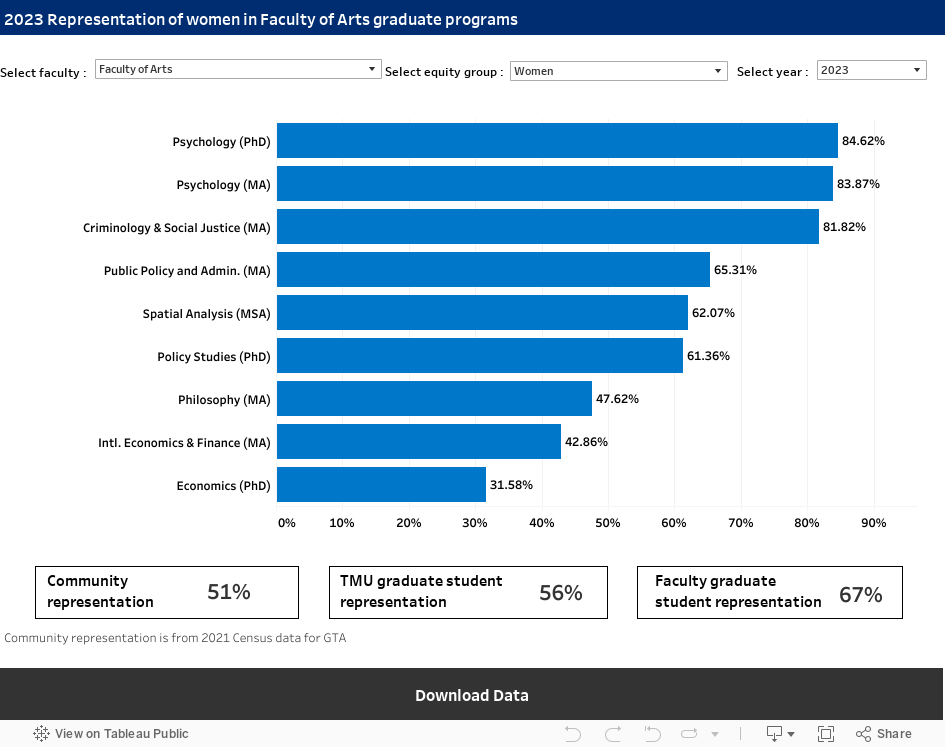
Program representation by year and faculty
Here are some notes to help navigate the visual representations:
- The Y-axis in the chart (vertical axis) lists the programs, and the percentage of student representation in the programs is shown on the X-axis (horizontal axis).
- The bars extend to the percentage representation of the equity group named in the title, in each program, ordered from the program with the highest representation to the program with the lowest representation.
- For comparison purposes, data on the representation of the selected equity group in the TMU graduate student population, graduate student population in the faculty, and in the external community are shown at the bottom of the graphs.
- If a new program did not exist in prior years, data is only provided for the most recent year of published data.
- If a program has been discontinued, data is only provided for the years it existed.
- If the name of a program has changed, the program name for the most recent year of published data is used.
Hovering over a bar or line shows the details.
Privacy safeguards
To protect individual privacy, data is only made available for programs with 20 or more students. To make sure that data for as many programs as possible are provided, students in the same program, but in part-time, co-op or other options, are combined. In addition, some related programs are combined, such as professional diploma programs in the Ted Rogers School of Management. In double major programs with less than 20 students, the data is added to each of the programs in the double major.
Need the data in an alternative format?
Accessibility is an important goal for us. If you have questions or if the data visualization content is not accessible using the features and alternate formats described above, please contact the Research, Planning and Assessment unit in the Office of the Vice-President, Equity and Community Inclusion at diversitydata@torontomu.ca for further assistance.
