How long does it take for a single message to be broadcasted across a large network?

Reaz Huq
How quickly does fake news spread on social media? Or a disease like COVID-19 spread in a large city? Or autonomous and connected vehicles share information? To begin to answer these questions, it’s useful to focus on the nature of a network, which is basically made up of relationships. Communication within those relationships determines the speed of transmission, whether of information or something like a virus.
To better understand the broadcasting process, master’s student in applied mathematics Reaz Huq posed a question to then be answered in the language of mathematics: “If there is a message which can only be spread by one individual communicating it directly to another, how quickly does the message spread within a network?” With the support of advisor Pawel Pralat of Ryerson’s Department of Mathematics and team members Atefeh Mashatan (Information Technology Management, Ryerson University), Bogumil Kamiński (Warsaw School of Economics) and Przemyslaw Szufel (Warsaw School of Economics), Huq published the research results in the journal Discrete Applied Mathematics (external link) .
In order to proceed, the research team framed the question in terms of a branch of mathematics known as graph theory. These are not the graphs that may be familiar from first-year economics class, where one variable is plotted against another. Rather, the graphs in graph theory consist of a set of nodes (sometimes called vertices). Two nodes in the graph may form an edge between one another. For instance, given a square, the corners could represent vertices and the lines linking them be edges. This could be done with a pentagon, or a hexagon, or any other flat shape. Graphs of this form are known as cycles. It is possible to take, say, five nodes and have each node connected with the other four nodes—or six nodes, or seven nodes, or any number of nodes. Graphs of this form are known as cliques.
“All sorts of real-world networks can be modelled with graphs,” says Huq. “For instance, we can make a graph of Instagram users, where nodes represent users and edges represent them following each other. Or we could model traffic networks by letting nodes represent intersections and edges represent roads.”

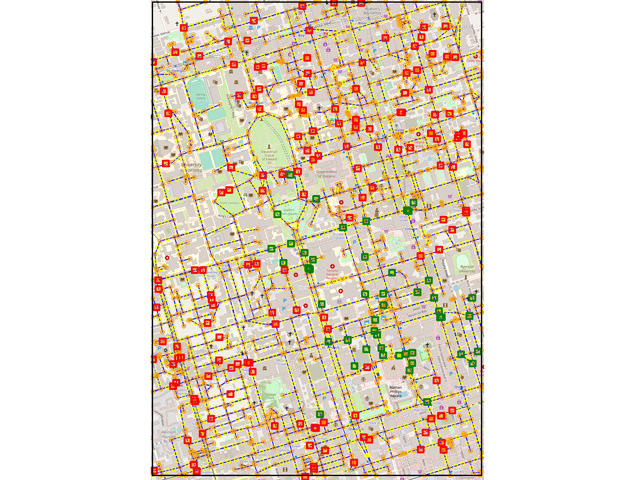
Traffic networks can be modeled as graphs. In the figure above, vehicles were represented as either green or red squares. They moved along the roads by traveling between the circles that were connected by the black lines. If an agent was green, they were in possession of a message which could be passed to red agents by getting close to them.
Huq’s research focused on very large cliques, and then he extended the results to paths and cycles. The team placed some agents along the graph and let them move randomly around it. They randomly selected one agent to possess a message and allowed it to be spread if the messenger agent bumped into another without the message. The question was how long it would take for each agent to get the message, with the team recording varying results for different numbers of agents.
“We found that the message started to spread more quickly when there were more agents on the graph,” says Huq. “This is perhaps unsurprising; after all, the more people there are in a network, the more likely it will be that they bump into one another.” On the other hand, having more agents means the process needs to reach more of them, and the process is highly non-trivial to analyze.
However, other results were surprising. The team expected the slowest part of the process to be the beginning but found that the end of the process was also similarly slow. If very many people have a message, it can, in some situations, be much more likely that they bump into one another rather than into the small minority which does not have the message.
With the study of broadcasting messages not well researched, Huq and his team have published one of the first works in this area. While the specific class of graphs studied does not perfectly mirror real-world networks, the results provide important insights useful for establishing a framework for the study of more complicated types of graphs.
“The next steps for our research, as mathematicians, would be to theoretically study different types of graphs, such as grids,” says Huq. “We have already begun tackling some questions with real-world importance, such as modelling COVID-19 and cars that can communicate with one another. A natural extension would be to model the spreading of misinformation.” Since these graphs are more complex, different tools are needed to analyze them, such as extensive simulations.

Funding of this research was provided by NSERC Alliance, the SOSCIP COVID-19 Response Program, and the Fields CQAM project with NXM Technologies Inc.