Walkable Streetscapes Can Make Local Businesses More Attractive
By: Bon Woo Koo, Assistant Professor, School of Urban and Regional Planning, Toronto Metropolitan University
Uijeong Hwang, Researcher, School of City & Regional Planning, Georgia Institute of Technology
Subhrajit Guhathakurta, Professor, School of City & Regional Planning, Georgia Institute of Technology
October 1, 2024
(PDF file) Print-friendly version available
Executive Summary
Attractive local businesses can make cities more walkable by providing desirable destinations. This study explores whether features that enhance walkability also make local businesses more attractive. Using street view images and computer vision, it examines the relationship between walkable streetscape features and customer satisfaction of restaurants and coffee shops, based on Yelp review scores in Atlanta, Georgia. After accounting for factors such as pedestrian accessibility, restaurant type, and neighbourhood characteristics, the study finds that landscaped sidewalks, more visible greenery, and more enclosed streetscapes (higher building-to-street ratio) positively impact customer satisfaction. Suggestions for planning walkable streetscapes are provided to enhance street vibrancy and economic opportunities for local businesses.
Key findings:
- Restaurants and coffee shops on pedestrian-friendly streetscapes tend to receive higher Yelp customer review scores than similar shops on less pedestrian-friendly streetscapes;
- Specifically, customer review scores increase when streets are narrow and lined with tall buildings, have more street greenery, and have sidewalks that are landscaped to separate them from traffic;
- Contrary to conventional belief, being at an easily accessible location does not necessarily lead to better customer satisfaction; and
- Walk Score correlated with higher customer review scores only in very unwalkable areas (e.g., quiet and secluded places) or highly walkable areas (e.g., vibrant commercial strips), but not in between.
Background
Walkability and attractive local businesses have a reciprocal relationship. Attractive local businesses can make cities more walkable by providing desirable destinations to walk to (Walk Score, n.d.), and walkable urban forms can support local businesses by providing better accessibility to pedestrians and attracting more customers (Pivo & Fisher, 2011). This mutually reinforcing relationship suggests that walkability has not only social, environmental, and health benefits but also economic benefits to local establishments. While existing studies showed walkable urban forms (e.g., high Walk Score or population density) provide economic benefits, few examined the impact of streetscapes–more fine-grained design details at street level.
Studying how walkable streetscapes affect businesses has been challenging due to the need for both customer surveys and on-site audits of the streetscapes, which are often costly. This study replaced customer surveys with Yelp’s customer review scores and on-site streetscape audits with the combination of Google Street View images and artificial intelligence, respectively. This made it possible to assess all restaurants with at least 10 reviews on Yelp and its streetscapes in just a few hours.
How the Study was Conducted
This study was conducted within the city limit of Atlanta, Georgia, USA. To study customer satisfaction, we used Yelp's crowd-sourced data on the location, average review score (from 1 to 5), number of reviews, business type, and price level of restaurants and coffee shops.
Pedestrian accessibility was measured using the common accessibility measures used in the literature, including population and employment density, distance from the city center, and Walk Score.
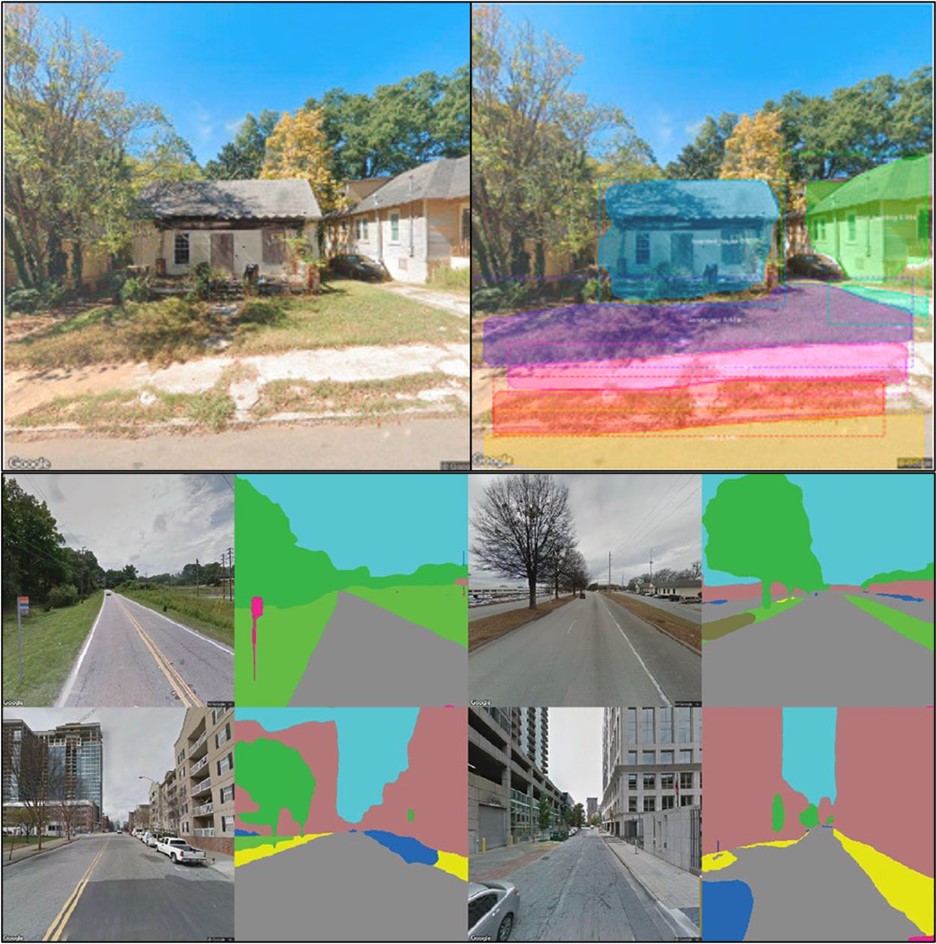
We quantified streetscape characteristics of the closest street segment to each business location using Google Street View (GSV) images and artificial intelligence for image processing (Figure 1). Several characteristics were measured to represent diverse aspects of the streetscapes important for pedestrians, including building-to-street ratio, amount of greenness visible on streets, the presence of crosswalks, walk signals, sidewalks, buffers, and streetlights.
Other factors thought to be important for customer satisfaction are also considered, including the distance from the city center and the number of crimes within walking distance.
We first examined the correlations between streetscape features (e.g., greenery on streets) and walkable urban form measures (e.g., development density) to examine whether favourable streetscape features and walkable urban forms co-exist. We then used a statistical modelling technique called fractional response logistic regression (FR regression) to investigate which factors are meaningfully contributing to customer satisfaction. Fractional response logistic regression is a statistical model designed to handle outcomes that fall within the range of zero to one. For our analysis, we transformed Yelp review scores, which range from 1 to 5, into a normalized scale between 0 and 1. FR regression was selected to reflect that Yelp review scores have inherent lower and upper limits. If, for example, people tend to prefer restaurants and coffee shops in densely developed areas, the population and employment density measure would show ‘significance’ in the modelling results.
Figure 1: Input and output images of computer vision, a type of artificial intelligence for image processing.

The top two images demonstrate the instance segmentation process, where the locations and outlines of individual objects are identified. The bottom eight images illustrate semantic segmentation, where each pixel of an image is labeled with a specific category. The two different approaches to image processing allow planners to get insights into different dimensions of street environments.
Findings
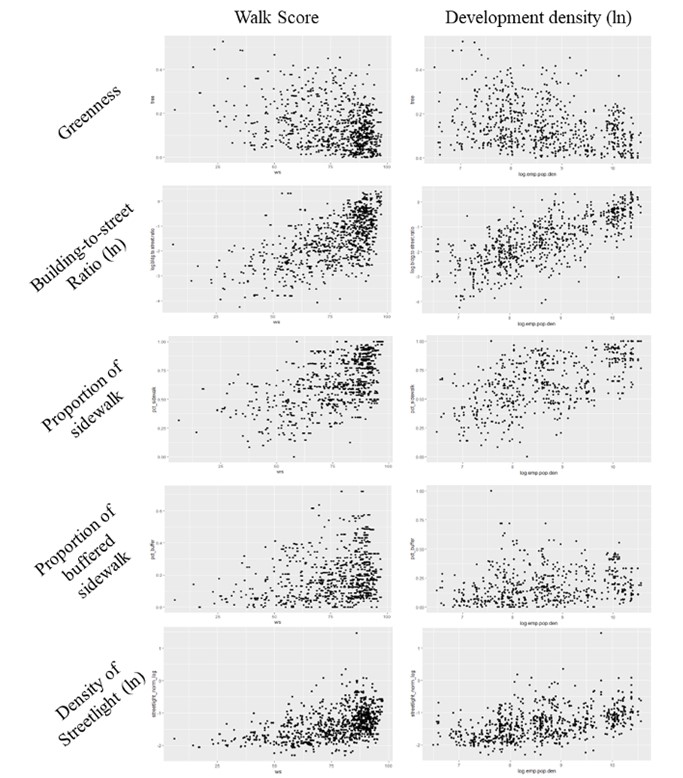
Several interesting findings were discovered. The correlation analysis and the scatterplot in Figure 2 showed that many walkable streetscape features had positive correlations with walkable urban forms, with sizable coefficients reaching as high as 0.74. However, street greenery was an exception, showing moderate negative correlations. Buffered sidewalks with landscape also showed weak correlations (0.23 with Walk Score and 0.18 with development density).
Figure 2: Scatter plot of walkable streetscape features (rows) and walkable urban forms (columns).

Second, the regression models showed that customer satisfaction decreased as development density increased. Walk Score positively contributed to customer satisfaction only when it was either very low or high. This indicates that the ease of accessing a certain destination does not necessarily have a positive impact on customer satisfaction.
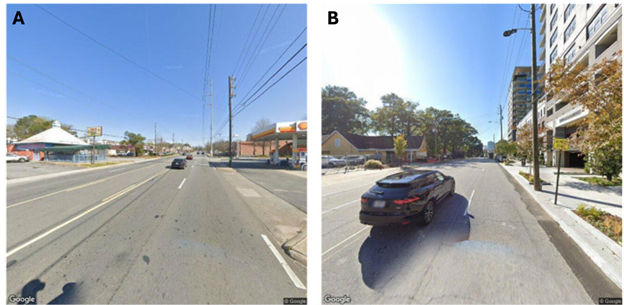
Third, some streetscape features showed meaningful contributions to customer satisfaction, including i) streets are narrow and lined with tall buildings (i.e., high building-to-street ratio, which represents more enclosed streetscapes), ii) greenness visible on the streets, and iii) sidewalks that are landscaped to separate them from traffic. A restaurant located at highly favourable streetscapes (e.g., an enclosed street with ample greenery and landscape sidewalks) is estimated to receive customer review scores that are over 0.4 points higher than comparable restaurants located at a street with unfavourable streetscapes (See Figure 3 for examples). Considering a 1-point increase in review score is associated with up to 9% increase in revenue (Luca, 2016), this is a sizable effect.
Figure 3 shows example streets from the dataset used in this study. Image A in Figure 3 is from the bottom 25th percentile for all three streetscape features. It shows a combination of (i) low buildings and (ii) wide roads, which results in low enclosure. It also shows (iii) a lack of greenery and (iv) pedestrian infrastructure such as sidewalks and sidewalk buffers. In contrast, Image B has (i) tall buildings on one side, (ii) buffered sidewalks, (iii) ample greenery, and (iv) streetlights. Despite the similar road width, street B is more enclosed, human scale, and comfortable than street A. Compared to restaurants on streets like A, those on B are predicted to have about 0.24 points higher review scores.
Fourth, the insignificance of the proportion of sidewalks and the presence of walk signals or crosswalks was unexpected. One possible explanation is that both sidewalks and crossing infrastructures are ubiquitous on commercial streets, particularly in urban areas. For example, our data showed that about 95% of the restaurants are located on streets with walk signals and/or crosswalks.
Figure 3: Examples of unfavorable streetscapes on the left in Image A (in the bottom quintile) and more favorable streetscapes in Image B (about 65th percentile) extracted from the dataset used in this study.

Discussion
Walkability offers numerous benefits to urban residents, yet most studies have focused on urban forms rather than streetscapes. Considering that urban form is much more durable and harder to change than streetscape features, the findings of this study provide several actionable implications to planners.
For example, planning and policy tools for modifying the three streetscape features influencing customer satisfaction include road diet (i.e., reducing the number and/or width of vehicle lanes), setback regulations, urban greening, and providing buffered protection to the pedestrian zone. It is important to point out that the measure of building-to-street ratio can be increased by either increasing building heights or decreasing street width. Increasing building-to-street ratio may be possible even in areas where increasing the overall density (e.g., constructing more buildings and/or building them taller) is not feasible. The road diet is one well-known strategy that can achieve this goal, particularly if it increases sidewalk buffers. Another way to increase building-to-street ratio is by reducing building setbacks, which is the space between the street and the facade of buildings. Many New Urbanism thinkers and Complete Street advocates argue for the importance of setback regulations for increasing permeability to frontages as well as for enhancing the overall enclosure of the streetscapes.
Planting street trees can be another effective strategy for providing a sense of enclosure. It can be accompanied by providing sidewalk buffers since they can share the furniture zone of sidewalks. Both trees and buffers can offer protection from moving vehicles while providing restorative effects.
One important consideration in increasing greenness is that heavily developed areas (e.g., areas with very high building-to-street ratio) tend to have less space available for street trees and landscapes (Giarrusso, 2018). One useful approach in densely built-up areas is to leverage planning tools that relax the regulation on floor area ratio (FAR) to developers who agree to provide publicly accessible spaces within their lot, such as privately owned public spaces (POPS). Such policies can allow planners to not only increase both building heights (e.g., higher building-to-street ratio) but also acquire space for greenery that is otherwise expensive to acquire.
References
Giarrusso, T. (2018). Assessing urban tree canopy in the City of Atlanta: Detecting changes between 2008 and 2014. Atlanta: Georgia Tech Research Corporation. [Online]. Available: (PDF file) https://geospatial.gatech.edu/AtlantaUTC/_include/Assessing%20Urban%20Tree%20Canopy%20in%20the%20City%20of%20Atlanta%20-%20A%20Baseline%20Canopy%20Study.pdf
Koo, B. W., Hwang, U., & Guhathakurta, S. (2023). Streetscapes as part of servicescapes: Can walkable streetscapes make local businesses more attractive? Computers, Environment and Urban Systems, 106, 102030. [Online]. Available: https://www.sciencedirect.com/science/article/pii/S0198971523000935 (external link)
Luca, M. (2016). Reviews, reputation, and revenue: The case of Yelp. com. Com (March 15, 2016). Harvard Business School NOM Unit Working Paper, (12-016). [Online]. Available: (PDF file) https://www.hbs.edu/ris/Publication%20Files/12-016_a7e4a5a2-03f9-490d-b093-8f951238dba2.pdf
Pivo, G., & Fisher, J. D. (2011). The walkability premium in commercial real estate investments. Real Estate Economics, 39(2), 185–219. [Online]. Available: https://onlinelibrary.wiley.com/doi/10.1111/j.1540-6229.2010.00296.x (external link)
Walk Score. (2023). Walk score methodology. [Online]. Available: https://www.walkscore.com/methodologyhtml (external link)