Not Addressing All the Costs To Drivers and Passengers Results in Excessive Automobile-Restricting Policies
By: Frank Clayton, Senior Research Fellow, with research assistance from Yagnic Patel
September 23, 2024
(PDF file) Print-friendly version available
Executive Summary
A widespread sentiment among some urban planners and other urban analysts is that automobile reliance should be diminished or even eliminated in portions of urban areas. The discussion often dismisses or superficially treats the costs that these measures impose on automobile-owning households and their occupants.
The background data series examined in this blog illustrates the pervasiveness of the automobile in the lives of residents of the Toronto urban region and the province.
The review of background automobile-related data found:
- Most commuters in the Toronto region commute by car, and the proportion is higher than before the pandemic;
- Most households in the Toronto region are automobile owners; and
- The number of registered vehicles in Ontario is increasing despite a marginal decline in 2022.
Two benefit-cost literature reviews show that methodologies for transportation projects and initiatives generally include travel time costs for automobile users but do not include a comprehensive assessment of the impacts imposed on these users. A review of an analysis prepared by the City of Toronto of the interim impacts of automobile-restricting measures on a portion of Bloor Street West is deficient. It does not apply an overall benefit-cost framework, where impacts are monetized to the extent possible to permit an overall comparison of benefits and costs.
When considering or implementing policies to restrict the use and convenience of the automobile, the interests of this large community should not be ignored. Undue burdens on automobile users will have a negative impact/cost on a significant proportion of the population.
Introduction
A widespread sentiment among some urban planners and other urban analysts is that automobile reliance should be diminished or even eliminated in portions of urban areas. Policies making life more difficult for automobile drivers and passengers include:
- Reducing available lanes by converting them to bike lanes;
- Prohibiting automobiles on certain streets;
- Lowering speed limits;
- Increasing parking rates;
- Reductions in parking spaces;
- Not expanding or building new roads to accommodate the growing number of automobiles on the road; and
- Discouraging suburban development.
Proponents state that making life more difficult for automobile traffic will have benefits, including improved safety for pedestrians and cyclists, reduced fossil-fuel-generated greenhouse gas emissions, and denser development around transit stations as more people use public transit, walk, and cycle.
The discussion often dismisses or superficially treats the costs that these measures impose on automobile-owning households and their occupants. These costs include:
- Longer and increasingly uncertain commute times;
- Added fuel, maintenance and depreciation costs;[1] and
- Households desiring affordable ground-related housing select suboptimal distant locations due to automobile-restricting planning policies that increase the price of houses in urban areas where they prefer to live.[2]
This blog examines three data series which underscore the importance of explicitly incorporating these broader costs borne by automobile drivers and their passengers into analyses of the benefits and costs of automobile-restricting policies. It also examines the treatment of automobile user costs in the benefit-cost literature and examines a City of Toronto case study.
Assessing automobile driver and passenger costs - what the literature and the City of Toronto say
There are established techniques for assessing the impacts of sizable transportation projects, including benefit-cost analysis.
Couture, Saxe and Miller
Couture, Saxe and Miller define benefit-cost analysis as the following:
A cost benefit analysis relies on estimation of the costs of building and operating a proposed project over its useful lifetime as well as the envisioned time-stream of benefits expected to accrue from the project.[3]
Among the measurable impacts considered in the Couture, Saxe and Miller literature review is the impact on travel time, which can be monetized. In addition, at least one transportation agency they examine considers impacts on congestion and punctuality/reliability.
Litman
Todd Litman's literature review focuses on the impacts (benefits and costs) of policies and projects that improve active transportation conditions and increase active mode use, like those being implemented by the City of Toronto.[4] He considers measurable costs to automobile users and passengers, including:
- Vehicle operating costs;
- Mileage-related deprecation;
- Tolls and parking fees;
- Vehicle traffic impacts: incremental delays to motor vehicle traffic or parking; and
- Travel time: incremental increases in travel time costs due to slower modes.
Litman also incorporates land use planning impacts but not from the perspective of households locating further afield because of affordability impacts.
Toronto Region Board of Trade (TRBOT)
In a 2003 brief, TRBOT addressed the issue of congestion in both the city of Toronto and the broader region. It highlighted that Toronto traffic congestion is at crisis levels, ranking third in North America for traffic delays per person.[5] It also found that the average driver in Toronto lost 118 hours due to congestion in 2020, and the region lost an estimated $11 billion annually in lost productivity and opportunity.
City of Toronto
The City of Toronto is converting portions of arterial roads to complete roads by removing motor vehicle lanes to accommodate cyclists and pedestrians. For Phase 1 of the Bloor Street West Complete Street Extension, staff utilized several variables in its interim conditions data update.[6] Below is a brief description of the main variables and the interim findings based on survey data. The comparisons are for November 2022 – March 2023 before street changes were implemented and November 2023 – March 2024 after implementation.
Key variables include:
- Vehicle travel times: Travel times for vehicles saw an increase by averages of 2.4-4.4 minutes eastbound and 1.5-3.6 minutes westbound, depending on the time of day;
- Vehicle speeds: Average speeds decreased across all locations by about 17%, with the largest reduction at almost 30%.[7] Posted speeds were reduced from 50 km/h to 40 km/h;
- Vehicle volumes: Vehicle volumes remained relatively consistent before and after the changes at 18,000 vehicle trips in both directions over 24 hours; and
- Cycling volumes: Bicycle volumes increased by about 60% on average for 14-hour two-way volume from approximately 75-750 people to 370-835 people.
While the Toronto analysis contains some elements of a comprehensive benefit-cost analysis, it falls short. It shows that the Bloor Street West transportation changes increased the average travel times of 18,000 automobile users by 1.5-4.4 minutes daily (the costs) to accommodate an increase of 85-295 cyclists (the benefits). These impacts are not monetized. A comprehensive benefit-cost analysis would include many more variables including the impacts on congestion.[8]
Background data series[9]
This blog examines three data series that underscore the importance of incorporating the broader costs of automobile drivers and their passengers into analyses of the benefits and costs of automobile-restricting policies. These are:
- The main mode of commuting to work: The proportion of commuters commuting by automobile (car, truck or van) for the Toronto census metropolitan area (CMA) in 2016 and 2024 is examined;
- The proportion of households owning one or more automobiles: The proportions for three census metropolitan areas (CMAs) in 2021 are examined here – Toronto, Oshawa and Hamilton; and
- Growth in the number of registered vehicles: Statistics are available only at the provincial level up to 2022.
Most commuters in the Toronto CMA commute by car, and the proportion is higher than before the pandemic.
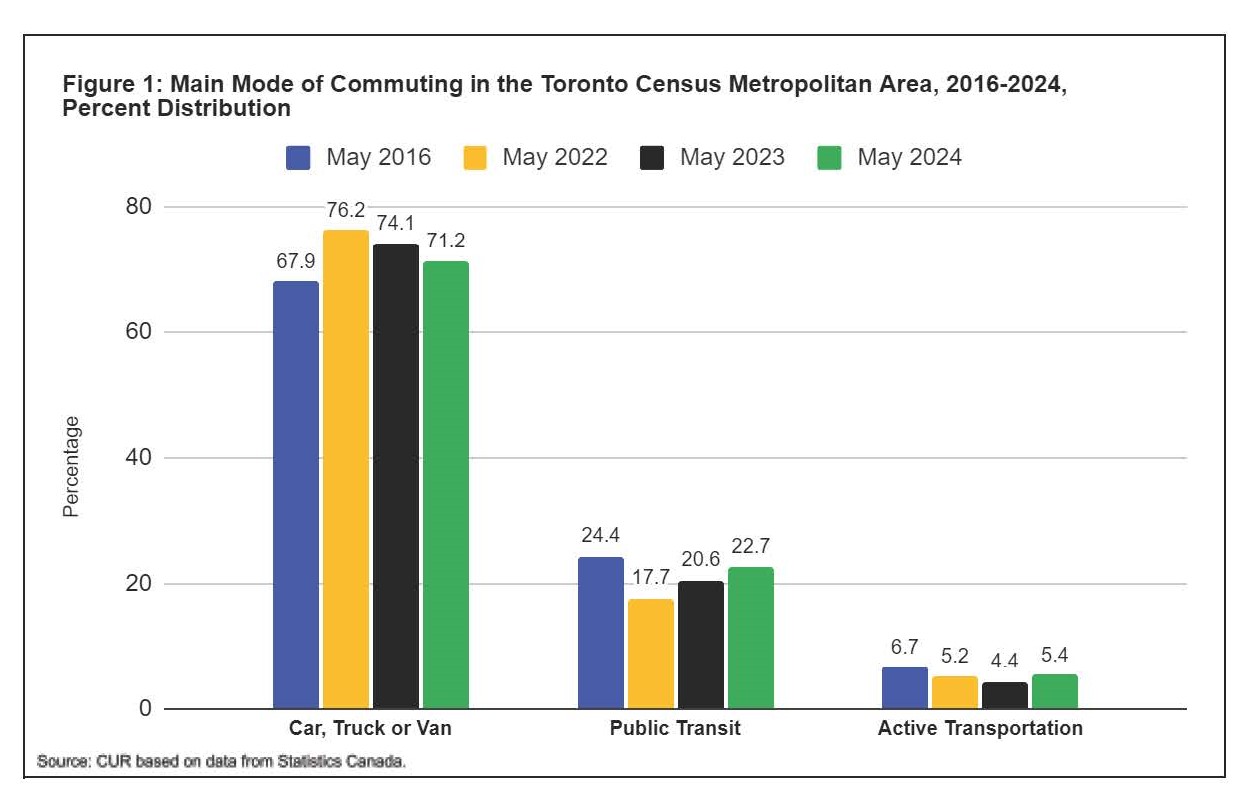
Figure 1 shows data on commuters' main mode of transportation in the Toronto CMA before the pandemic (May 2016) and most recently (May 2024).[10]

The proportion of commuters travelling by automobile is now higher than in 2016 – 71.2% vs 67.9%. Comparatively few commuters travel to work via active transportation modes (walking or cycling) – just 5.4% in 2024 compared to 6.7% in 2016.
The proportion of automobile commuters rose during the pandemic to 76.2%, declining to 71.2% in 2024. Transit benefited from the decline in the proportion of automobile commuters. However, the proportion of active transportation commuters remained low.
Automobile-restricting policies, therefore, impact the vast majority of commuters.
Most households are automobile owners.
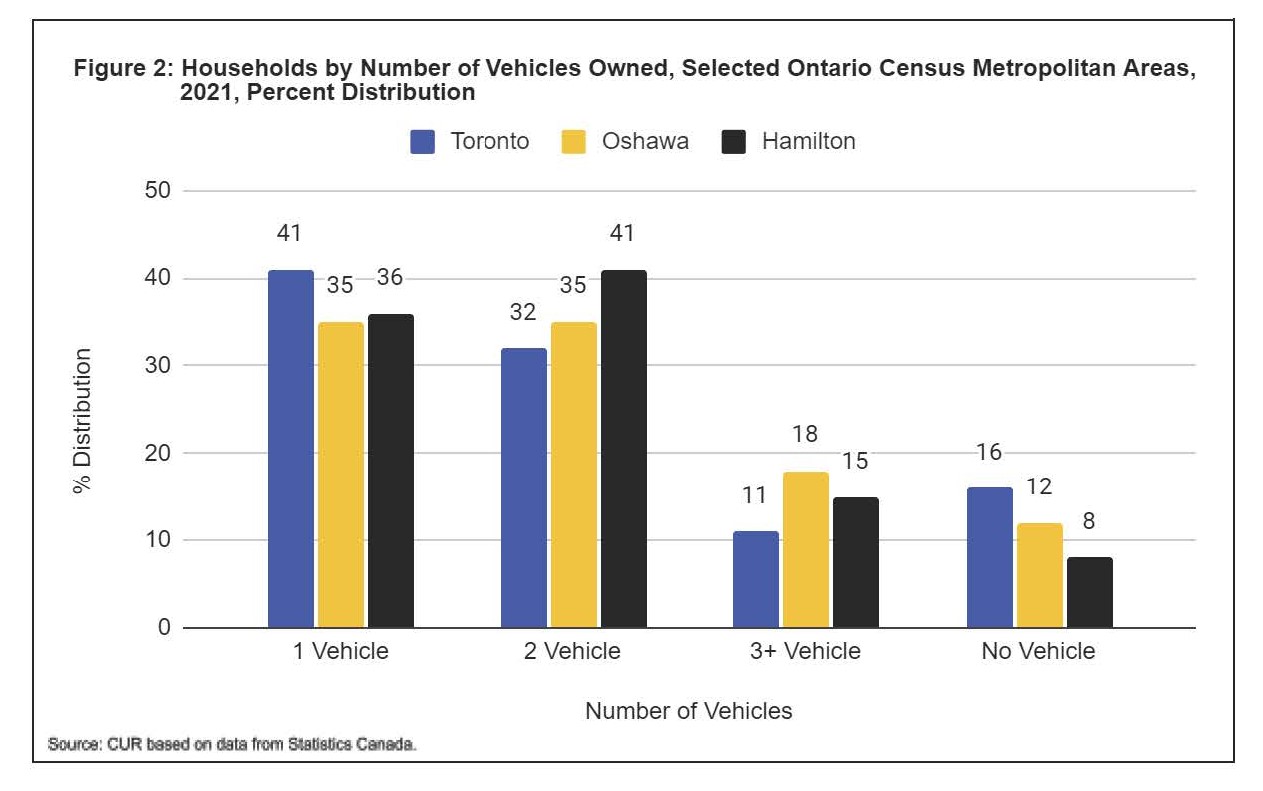
Figure 2 presents Statistics Canada's recently released data on vehicle (automobile) ownership in three census CMAs - Toronto, Oshawa and Hamilton - in 2021 (the most recent year that data is available).[11] Many vehicle-owning households utilize their vehicles to commute to and from work (see Figure 1).

Most households own at least one automobile, with many owning two or more vehicles.
In 2021:
- 84% of Toronto CMA households owned at least one vehicle – 16% did not own a vehicle;
- 88% of Oshawa CMA households owned at least one vehicle – 12% did not own a vehicle; and
- 92% of Hamilton CMA households owned at least one vehicle – 8% did not own a vehicle.
Thus, policies restricting or otherwise hampering automobile driving negatively impact lifestyles and impose costs on most households in these CMAs depending on the distance travelled and time of day (e.g. peak or off-peak hours).
The number of registered vehicles is increasing despite a marginal decline in 2022.
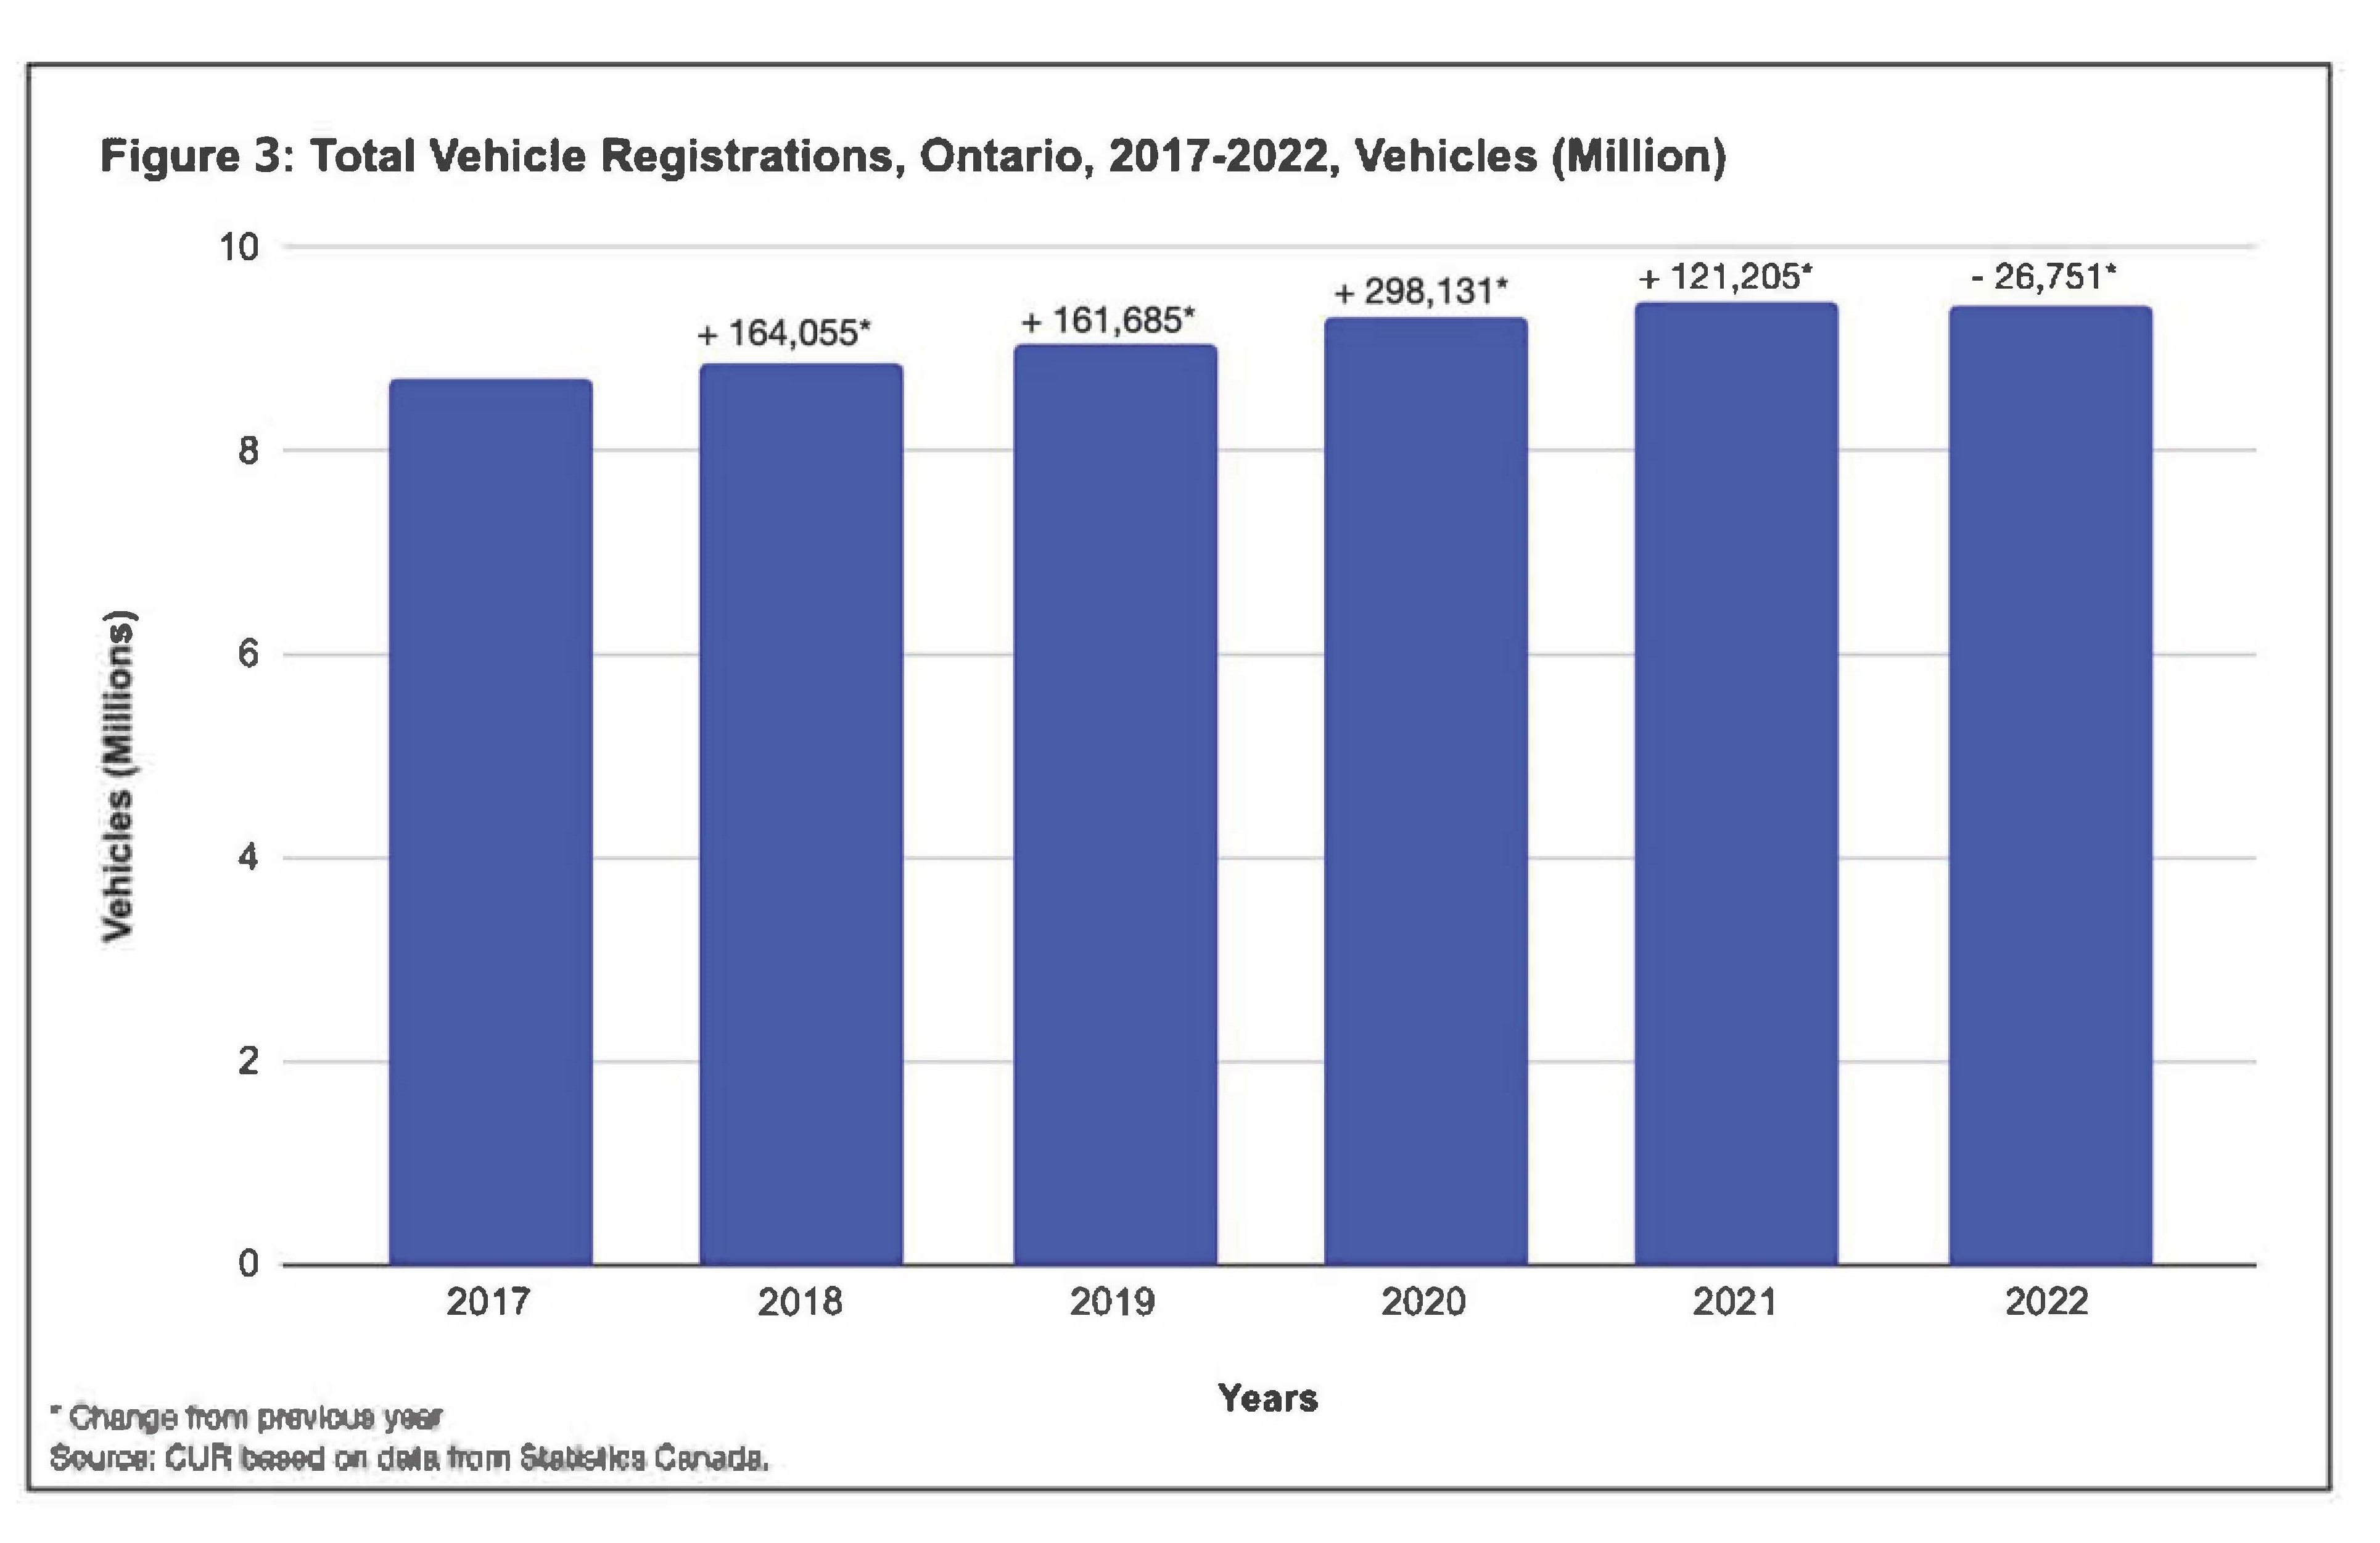
Figure 3 presents statistics on the total number and growth of vehicles registered in Ontario from 2017 to 2022 (the most recent year for which data is available). While sub-provincial statistics are not available, it is reasonable to extrapolate that the three CMAs examined also recorded increases in the number of vehicles registered as population and households grow.[12]

The number of vehicles registered in Ontario increased by an average of 143,665 per year between 2018 and 2022. Increases varied from 298,131 in 2020 to a decline of 26,751 in 2022.
The decline in 2022 was likely a short-term phenomenon. New motor vehicle sales are a significant component of the growth in total registrations. Ontario sales were robust during 2016-2019 (in the 821,762-866,848-vehicle range) but weakened in 2020-2022 (in the 641,885-667,365 range) before increasing to 719,569 in 2023.[13]
If the road system is not expanded by widening existing roads or building new roads in the province, increased congestion and longer travel times are inevitable, with more vehicles in play—meaning higher costs to automobile drivers and passengers.[14]
Conclusion
Two benefit-cost literature reviews show that methodologies for transportation projects and initiatives generally include travel time costs for automobile users but do not include a comprehensive assessment of the impacts imposed on these users. A review of an analysis prepared by the City of Toronto of the interim impacts of automobile-restricting measures on a portion of Bloor Street West is deficient. It does not apply an overall benefit-cost framework where impacts are monetized to the extent possible to permit an overall comparison of benefits and costs
The background data series illustrates the pervasiveness of the automobile in the lives of residents of the Toronto urban region and the province as a whole. When considering or implementing policies to restrict the use and convenience of the automobile, the interests of this large, vast community should not be ignored. Undue burdens on automobile users, who constitute much of the population, will significantly impact a high proportion of residents.
End Notes
[1] The costs mentioned in the first two bullets are part of what is known as congestion costs.
[2] Ground-related housing includes single- and semi-detached houses and townhouses. CUR researchers have highlighted the strong innate preference for ground-related housing, especially single-detached houses, by homebuyers and intending home buyers in the Greater Toronto Area. For example, Frank Clayton. What Kinds of Housing Are Homebuyers or Intending Homebuyers in the GTHA Choosing? CUR. June 28, 2022.
[3] L-E Couture, S. Saxe and E.J. Miller. Cost-Benefit Analysis of Transportation Investment: A Literature Review. University of Toronto Transportation Research Institute. July 2016.
[4] Todd Litman. Evaluating Active Transport Benefits and Costs: Guide to Valuing Walking and Cycling Improvements and Encouragement Program. Victoria Transport Policy Institute. July 31, 2024.
[5] Toronto Region Board of Trade. Congestion: What’s at Stake in Toronto’s 2023 Mayoral By-election. June 2023.
[6] City of Toronto. Bloor Street West Complete Street Extension: Data Update on Interim Conditions. June 2024. Phase 1 runs from Runnymede Road to Aberfoyle Crescent.
[7] At the 85th percentile. The 85th percentile speed represents the speed at or below which 85% of drivers operate.
[8] Potential congestion costs, in addition to the ones mentioned here, include those relating to safety and pollution from vehicle emissions and indirect costs in reduced business productivity. See U.S. Department of Transportation. Assessing the Full Costs of Congestion on Surface Transportation Systems and Reducing Them Through Pricing. February 2009.
[9] The data series are not available for the city of Toronto alone.
[10] Statistics Canada. More Canadians Commuting in 2024. The Daily. August 26, 2024.
[11] ‘Vehicles’ in this Statistics Canada survey are vehicles owned or leased by households, including gasoline, electric and hybrid vehicles. The terms ‘vehicle’ and ‘automobile’ are also used interchangeably here.
[12] Vehicle registrations for this Statistics Canada survey include light, medium and heavy-duty vehicles, buses, motorcycles and mopeds.
[13] Statistics Canada. New motor vehicle sales, by type of vehicle. June 14, 2024.
[14] This presumes the transit system is not expanded sufficiently to cause a discernible modal switch from automobiles to transit. Metrolinx’s 2041 Regional Transportation Plan for the GTHA predicted that even with all its recommended transit investment, the transit modal split increased by only 0.5 percentage points between 2011 and 2041 during peak morning rush hour. Metrolinx. (2018). 2041 Regional Transportation Plan for the Greater Toronto and Hamilton Area.
References
City of Toronto (2024). ‘Bloor Street West Complete Street Extension: Data Update on Interim Conditions.’ June 2024. [Online]. Available: (PDF file) https://www.toronto.ca/wp-content/uploads/2024/06/8fb5-BWCEDashboardFinal-AODA.pdf (external link)
Frank Clayton (2022). ‘What Kinds of Housing Are Homebuyers or Intending Homebuyers in the GTHA Choosing?’ CUR. June 28, 2022. [Online]. Available: (PDF file) https://www.torontomu.ca/content/dam/centre-urban-research-land-development/CUR_Preference_Homebuyers_Intending_Hombuyers_GTHA_June_2022.pdf
L-E Couture, S. Saxe and E.J. Miller (2016). ‘Cost-Benefit Analysis of Transportation Investment: A Literature Review.’ University of Toronto Transportation Research Institute. July 2016. [Online]. Available: (PDF file) https://uttri.utoronto.ca/wp-content/uploads/sites/19/2017/10/16-02-04-01-Cost-Benefit-Analysis-of-Transportation-Investment-A-Literature-Review.pdf (external link)
Todd Litman (2024). 'Evaluating Active Transport Benefits and Costs: Guide to Valuing Walking and Cycling Improvements and Encouragement Program.’ Victoria Transport Policy Institute. July 31, 2024. [Online]. Available: (PDF file) https://www.vtpi.org/nmt-tdm.pdf (external link)
Metrolinx. (2018). ‘2041 Regional Transportation Plan for the Greater Toronto and Hamilton Area.’ [Online]. Available: https://www.metrolinx.com/en/projects-and-programs/regional-transportation-plan (external link)
Statistics Canada (2024). ‘More Canadians Commuting in 2024.’ The Daily. August 26, 2024. [Online]. Available: https://www150.statcan.gc.ca/n1/daily-quotidien/240826/dq240826a-eng.htm (external link)
Statistics Canada. [Online]. Available: Statistics Canada. Table 20-10-0002-01 New motor vehicle sales, by type of vehicle (external link)
Statistics Canada. [Online]. Available: Table 23-10-0308-01 Vehicle registrations by type of vehicle and fuel type (external link)
Statistics Canada. [Online]. Available: Table 38-10-0173-01 Vehicles and charging stations owned by Canadian households (external link)
Toronto Region Board of Trade (2023). ‘Congestion: What’s at Stake in Toronto’s 2023 Mayoral By-election.’ June 2023. [Online]. Available: https://bot.com/Resources/Resource-Library/Congestion-2023-Issues-Guide (external link)
United States of America Department of Transportation (2009). ‘Assessing the Full Costs of Congestion on Surface Transportation Systems and Reducing Them through Pricing.’ February 2009. [Online]. Available: (PDF file) https://www.transportation.gov/sites/dot.gov/files/docs/Costs%20of%20Surface%20Transportation%20Congestion.pdf