Post-Pandemic, Housing Prices In Most Ontario Metropolitan Areas Remain Elevated Compared to Metropolitan Toronto
By: Frank Clayton, Senior Research Fellow, with research assistance from Yagnic Patel
September 3, 2024
(PDF file) Print-friendly version available
Executive Summary
This blog examines the percentage change in housing prices in Ontario census metropolitan areas (CMAs), with emphasis on the census metropolitan areas within the Greater Golden Horseshoe (GGH). The data source is the monthly Teranet-National Bank House Price Index (HPI), which tracks the repeat sales of the same properties. The analysis examines the period from January 2015 to June 2024, which encompasses pre-pandemic (January 2015 – February 2020), pandemic (March 2020 – May 2022) and post-pandemic (June 2022 - June 2024) sub-periods.
The analysis finds that:
- Prices have declined in the post-pandemic period from the current cycle's peak, with Toronto CMA prices dropping less than the other CMAs located within the GGH.
- In contrast, Toronto prices increased less than the other CMAs in the GGH in the pre-pandemic and, especially during the pandemic years.
- For the entire January 2015 to June 2024 period, housing prices increased significantly more in the eight other CMAs in the GGH than in Toronto.
There has been a fundamental shift in housing demand by Toronto CMA residents to other parts of the province due to a growing preference for more space and the relative scarcity and unaffordability of ground-related homes in the Toronto CMA. The smaller relative decline in prices in the Toronto CMA since the pandemic peak reflects some reversal of demand overexuberance for homes in fringe CMAs at the time of the pandemic. It is not a precursor to a shift in ground-related housing demand back to Toronto, like prior to the time Millennials moved into the homebuying age groups.
Introduction
The National Bank recently published a table for metropolitan areas across Canada showing housing price declines from the peaks reached during the pandemic (mid-2022) to June 2024.
This blog examines the price changes for Ontario census metropolitan areas (CMAs) with a focus on:
- Comparing housing price changes within the Greater Golden Horseshoe (GGH) since the pandemic peak.
- Comparing GGH housing price changes post-pandemic to changes before and during the pandemic.
- Comparing housing price changes in the Toronto CMA with the eight other CMAs in the GGH.
- Comparing price changes in the Toronto CMA with Ontario’s CMAs outside the GGH.
During the pandemic, favourable demographics, mortgage interest rates, and a sudden preference shift toward ground-related housing from high-rise apartments accelerated housing price increases. The higher interest rates imposed to fight rising inflation subsequently reduced demand and housing prices eased.
Demand shifted from the Toronto CMA—with the highest housing prices—to other CMAs within the GGH and beyond as households moved to secure more affordable housing.
An interesting question is whether this shift in demand is permanent or temporary. This blog strongly suggests that there has been a fundamental shift in housing demand by Toronto CMA residents to other parts of the province due to a growing preference for more space and the relative scarcity and unaffordability of ground-related homes in the Toronto CMA.
The smaller relative decline in prices in the Toronto CMA since the pandemic peak reflects some reversal of demand overexuberance for homes in fringe CMAs at the time of the pandemic but is not a precursor to a shift in ground-related housing demand back to Toronto, like prior to the time Millennials moved into the homebuying age groups.
Understanding the Teranet-National Bank House Price Index[1]
The Teranet-National Bank House Price Index (HPI) is a tool that tracks housing price fluctuations by CMA within Canada. It measures price changes based on the repeat prices of the same homes being sold. It is intended to provide a clearer picture of how housing values shift over time than changes in average or median prices can provide.
Features of the methodology for calculating the price changes include:
- At least two sales of the same property are required for the calculations.
- The sales pairs are weighted by creating a probability histogram of price changes.
- All types of ownership housing are included, whether bought by owner-occupiers or investors.
- The housing prices are expressed in terms of an index.
- Statistical techniques are applied to create the indexes.
Housing Price Changes Within the Greater Golden Horseshoe from Pandemic Peak to June 2024
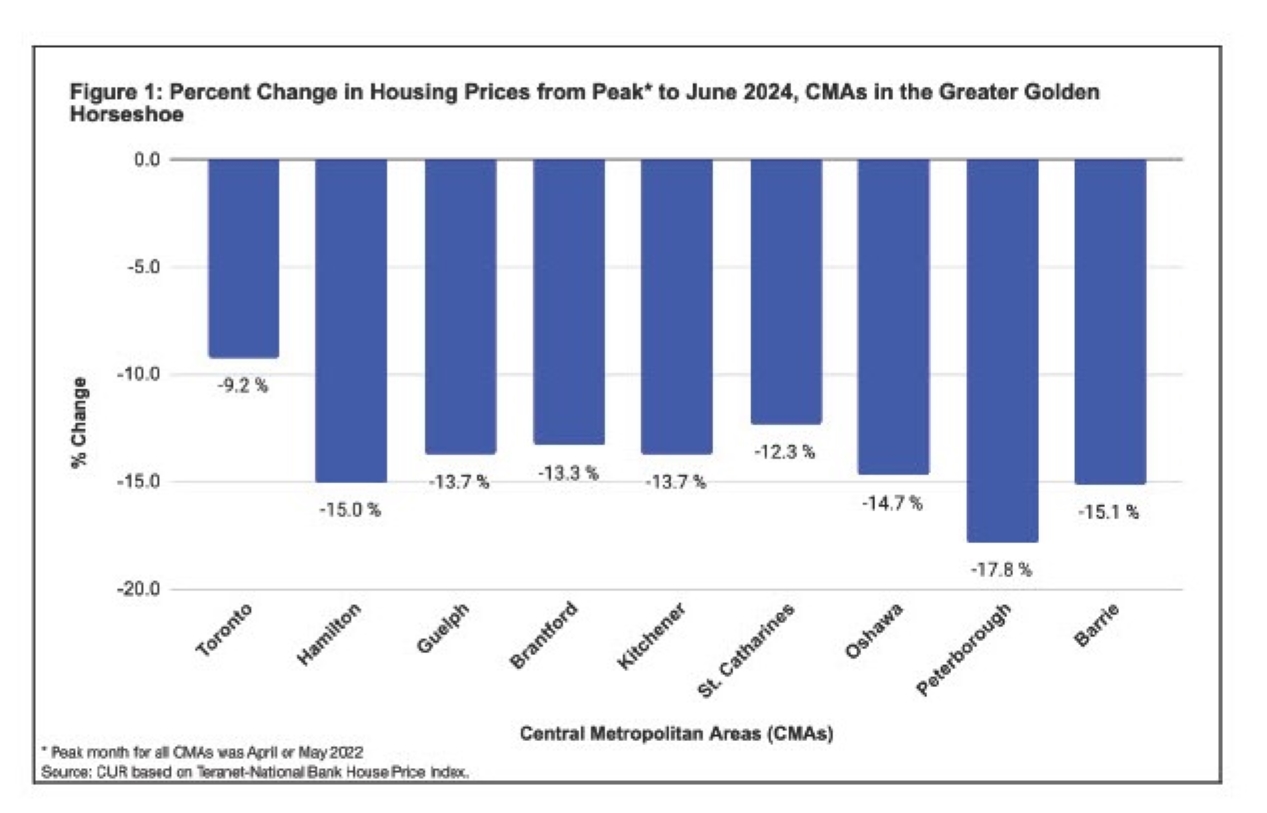
Figure 1 reproduces price changes in the HPI released by the National Bank in its July 17, 2024, report.[2] Price changes are shown for the nine CMAs within the GGH from the peak month (May or June 2022) through to June 2024.

According to the HPI, the Toronto CMA had the smallest decline between mid-2022 and mid-2024 (9.2%). Percent declines in the remaining CMAs ranged between 12.3% in Niagara-St. Catharines (St. Catharines) and 17.9% in Peterborough. Kitchener-Waterloo-Cambridge (Kitchener) recorded a decline of 13.7%.
This data suggests that the Toronto CMA’s housing market is outperforming the other CMAs since its decline is smaller. However, these declines should be placed within the context of price changes before and during the pandemic before definitive conclusions can be reached.
Housing Price Changes Within the Greater Golden Horseshoe from January 2015 to June 2024
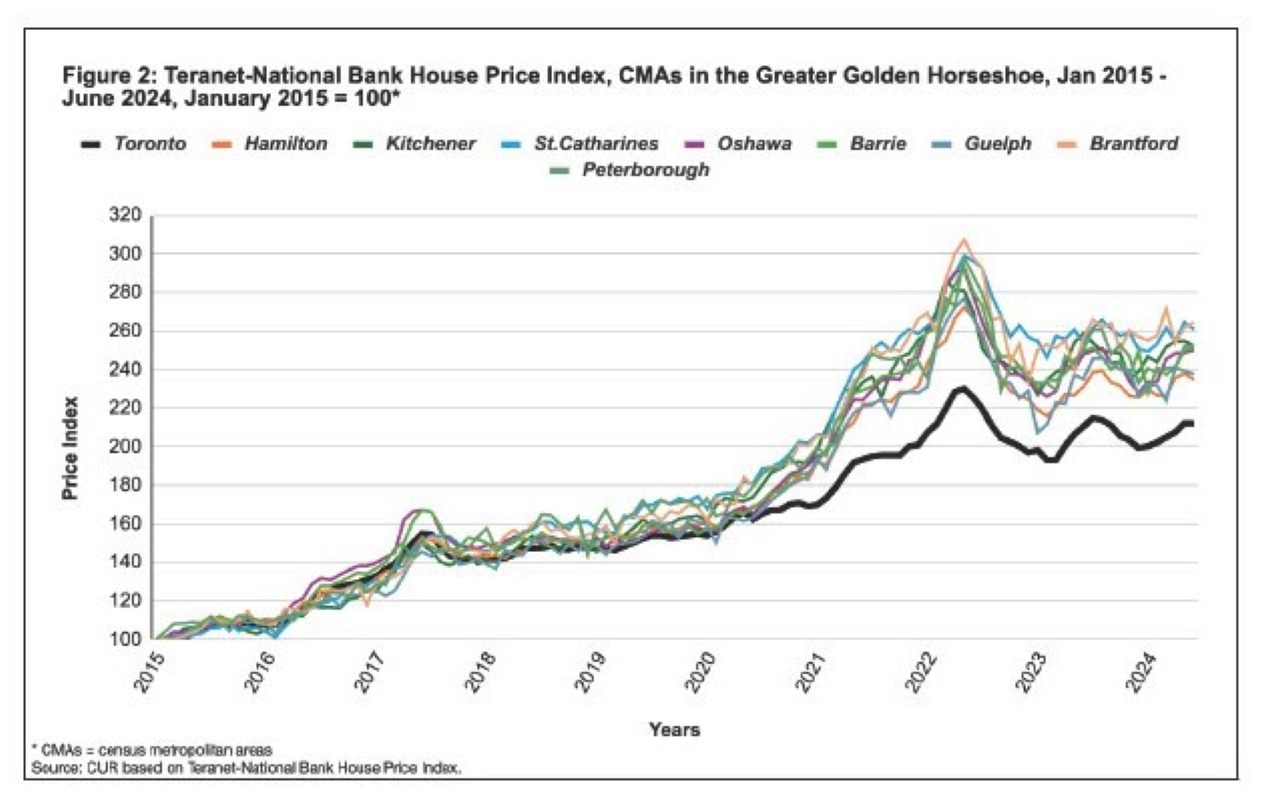
Figure 2 plots the monthly HPI for the nine CMAs within the GTA with January 2015 equal to 100. This period is divided into three parts: pre-pandemic (January 2005 – February 2020), pandemic (March 2020 – May 2022), and post-pandemic (June 2022 – June 2024).[3]

A notable takeaway is that housing prices in June 2024 had increased more since June 2015 in all CMAs than in Toronto.
Pre-pandemic: While the CMA increases seen between June 2015 and February 2020 followed similar patterns, it is notable that Toronto was among the lowest increases:
- Toronto’s percentage growth in home prices was 59% throughout this pre-pandemic period.
- Increases were marginally higher, in the 61% - 66% range, in Hamilton, Barrie, Guelph and Peterborough.
- Increases were in the 70% - 76% range in Brantford, Kitchener and St. Catharines.
Pandemic: Between March 2020 and May 2022, prices accelerated much faster in all eight of the GGH’s CMAs compared to Toronto:
- The other CMAs overshadowed Toronto’s percent increase of 44%.
- Increases in the other CMAs ranged from 62% in Kitchener to 80% - 81% in Peterborough, Brantford and Barrie.
Post-pandemic: In contrast to the pre-pandemic and pandemic phases, Figures 1 and 2 document a smaller percent decline in Toronto housing prices than the other CMAs.
For the entire January 2015 to June 2024 period, housing prices increased significantly more in the other eight CMAs in the Greater Golden Horseshoe than in Toronto.
Housing Price Changes: Toronto CMA vs CMAs Outside the GGH
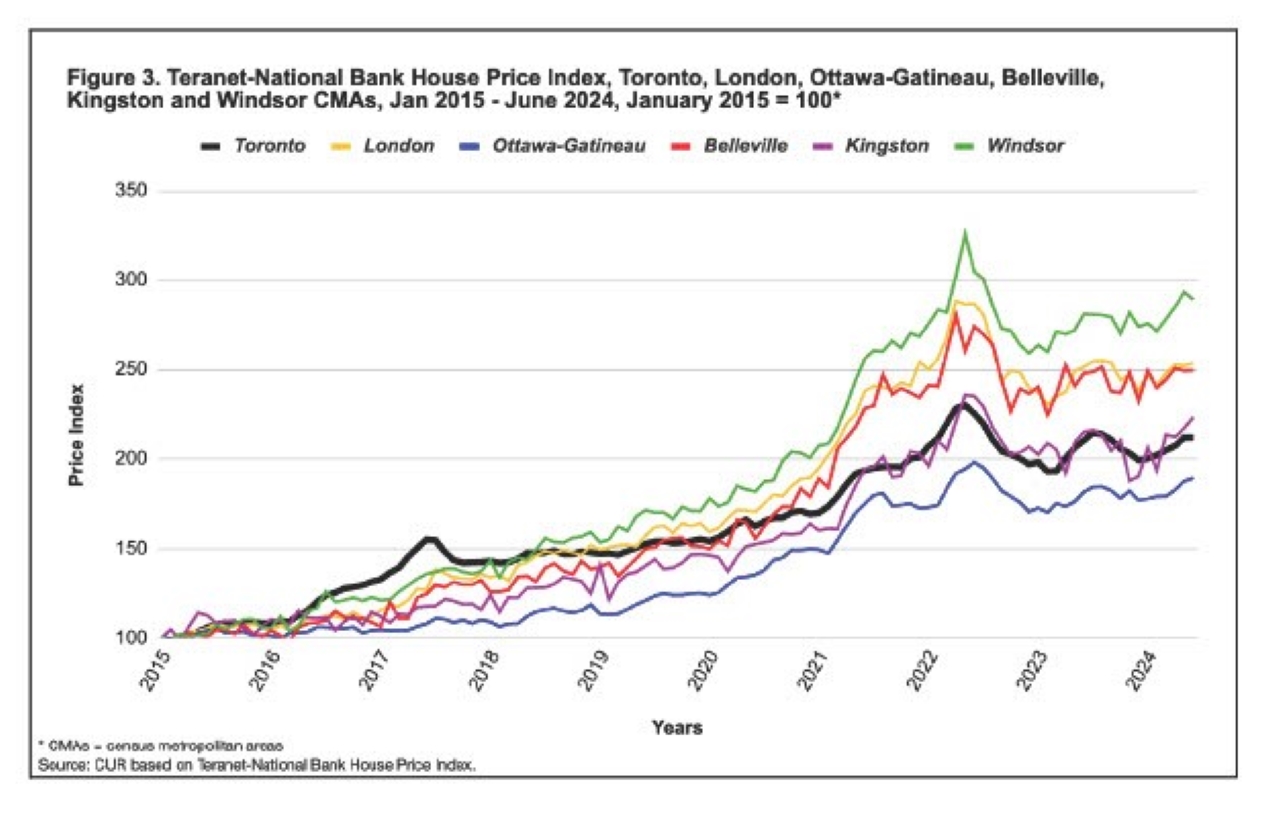
Figure 3 compares the housing price increase in the Toronto CMA to selected Ontario CMAs outside the Greater Golden Horseshoe from January 2015 to June 2024.

Windsor had the largest increase in housing prices, followed by London and Belleville. Kingston had about the same increase as Toronto.
Price increases in Ottawa lagged Toronto. A recent CUR study attributed this to differences in the municipal structures and the fact that Ottawa’s planning was not constrained by the provisions of the Growth Plan for the Greater Golden Horseshoe.[4] The other CMAs in the GGH also had shovel-ready land inventory constraints, resulting in sharper price increases when demand increased.
Analysis and Concluding Comments
The pandemic accelerated the shift in demand from the Toronto CMA to other parts of province as Millennials sought to find more affordable ground-related homes
A 2018 CUR report examined the millennial generation in the Greater Toronto and Hamilton Areas and its housing preferences over the coming decade. It predicted a robust demand for ground-related homes in suburban locations in response to supply constraints and rising prices.[5]
These findings resurfaced in a March 2021 CUR report:
Many Millennials are flush with cash from years of living at home with mom and dad and having high paying jobs. The pandemic may have accelerated homebuying decisions among them, but a surge in demand for ground-related housing in the suburbs was inevitable. Despite efforts by the province to get more housing of all types onto the market throughout the GGH, the new supply of ground-related housing is unlikely to increase enough to accommodate this surge in demand. As a result, prices will continue to rise faster than household income and affordability will worsen.[6]
A similar conclusion was reached in a CUR report released earlier this year describing the latest net intraprovincial migration flow estimates of Statistics Canada:
The worsening affordability of housing within the GTA is an important reason for the rising GTA net migrant losses during the past seven years. On the demand side, surveys conducted by Ipsos for the Toronto Regional Real Estate Board continually show that about 80% of all likely GTA homebuyers state they are most likely to purchase a ground-related home (55-60% a single-detached or semi-detached house). The bottom line is that we anticipate the continued dispersal of the residents of the GTA, particularly those residing in Toronto, York, Peel and Halton, as they search for the type and price of housing they want elsewhere in the GGH and other parts of the province.[7]
The fundamental shift in housing demand away from the Toronto CMA has resulted in housing prices narrowing between the Toronto CMA and most other Ontario CMAs.
There has been a fundamental shift in housing demand by Toronto CMA residents to other parts of the province due to a growing preference for more space and the relative scarcity and unaffordability of ground-related homes in the Toronto CMA. The smaller relative decline in prices in the Toronto CMA since the pandemic peak reflects some reversal of demand overexuberance for homes in fringe CMAs at the time of the pandemic but is not a precursor to a shift in ground-related housing demand back to Toronto, like prior to the time Millennials moved into the homebuying age groups.
End Notes
[1] National Bank. The Teranet–National Bank House Price Index Methodology.
[2] National Bank. Teranet-National Bank House Price Index Remained Stable in June. July 17, 2024.
[3] City of Toronto. City of Toronto reflects on pandemic response three years after Toronto’s first confirmed case of COVID-19. January 25, 2023.
[4] Frank Clayton. The Housing Affordability of Commutershed Land Use Planning: A Case Study of Ottawa and Toronto Metropolitan Areas. CUR. February 6, 2024.
[5] Diana Petramala and Frank Clayton. Millennials in the Greater Toronto and Hamilton Area: A Generation Stuck in Apartments? CUR. May 22, 2018.
[6] Diana Petramala. Demographics, Not Pandemic, Driving Real Estate Market Outcomes. CUR. GTA Housing Pulse. March 4, 2021.
[7] Frank Clayton. Residents Fleeing the City of Toronto, Peel and York Regions to Find More Affordable Homes. CUR. June 18, 2024.
References
Daren King, National Bank (2024). ‘The Teranet–National Bank House Price Index.’ [Online]. Available: (PDF file) https://www.nbc.ca/content/dam/bnc/taux-analyses/analyse-eco/logement/economic-news-teranet.pdf (external link)
National Bank (2024). ‘Teranet-National Bank House Price Index Remained Stable in June.’ July 17, 2024. [Online]. Available: https://housepriceindex.ca/2024/07/june2024/ (external link)
City of Toronto (2023). ‘City of Toronto reflects on pandemic response three years after Toronto’s first confirmed case of COVID-19.’ January 25, 2023. [Online]. Available: https://www.toronto.ca/news/city-of-toronto-reflects-on-pandemic-response-three-years-after-torontos-first-confirmed-case-of-covid-19/#:~:text=%E2%80%9CAcknowledging%20the%20three%2Dyear%20anniversary,loved%20ones%20and%20our%20families.
Frank Clayton (2024). ‘The Housing Affordability of Commutershed Land Use Planning: A Case Study of Ottawa and Toronto Metropolitan Areas.’ CUR. February 6, 2024. [Online]. Available: (PDF file) https://www.torontomu.ca/content/dam/centre-urban-research-land-development/pdfs/Toronto_Ottawa_CMA_Comparison_CUR.pdf
Diana Petramala and Frank Clayton (2018). ‘Millennials in the Greater Toronto and Hamilton Area: A Generation Stuck in Apartments?’ CUR. May 22, 2018. [Online]. Available: (PDF file) https://www.torontomu.ca/content/dam/centre-urban-research-land-development/pdfs/policycommentaries/CUR_Research_Report_Millennial_Housing_GTHA_May_22.pdf
Diana Petramala (2021). ‘Demographics, Not Pandemic, Driving Real Estate Market Outcomes.’ CUR. GTA Housing Pulse. March 4, 2021. [Online]. Available: (PDF file) https://www.torontomu.ca/content/dam/centre-urban-research-land-development/pdfs/CUR_GTA_Housing_Market_Pulse_March_4_2021.pdf
Frank Clayton (2024). ‘Residents Fleeing the City of Toronto, Peel and York Regions to Find More Affordable Homes.’ CUR. June 18, 2024. [Online]. Available: (PDF file) https://www.torontomu.ca/content/dam/centre-urban-research-land-development/BLOG/blog87/CUR_Blog_Intraprovincial_Migration_Flows_June_18_2024_final.pdf