The Majority of the GTA’s Combined New and Existing Home Sales Are Concentrated Outside the City of Toronto’s Borders
By: Frank Clayton, Senior Research Fellow, with research assistance from Yagnic Patel
August 16, 2024
(PDF file) Print-friendly version available
Executive Summary
This blog examines total home sales (both resale and new) in the Greater Toronto Area (GTA), split between the 416 area (the city of Toronto or Toronto) and the 905 area (the regions of Durham, York, Halton and Peel) in the time since the Growth Plan for the Greater Golden Horseshoe came into effect in 2006. It finds:
- The GTA represents a housing market area – individual municipalities within the GTA do not.
- The 905 area accounted for over half of all GTA sales (61%) between 2006 and 2023.
- The resale and new housing markets are closely intertwined – 75% of all GTA home sales are resale homes.
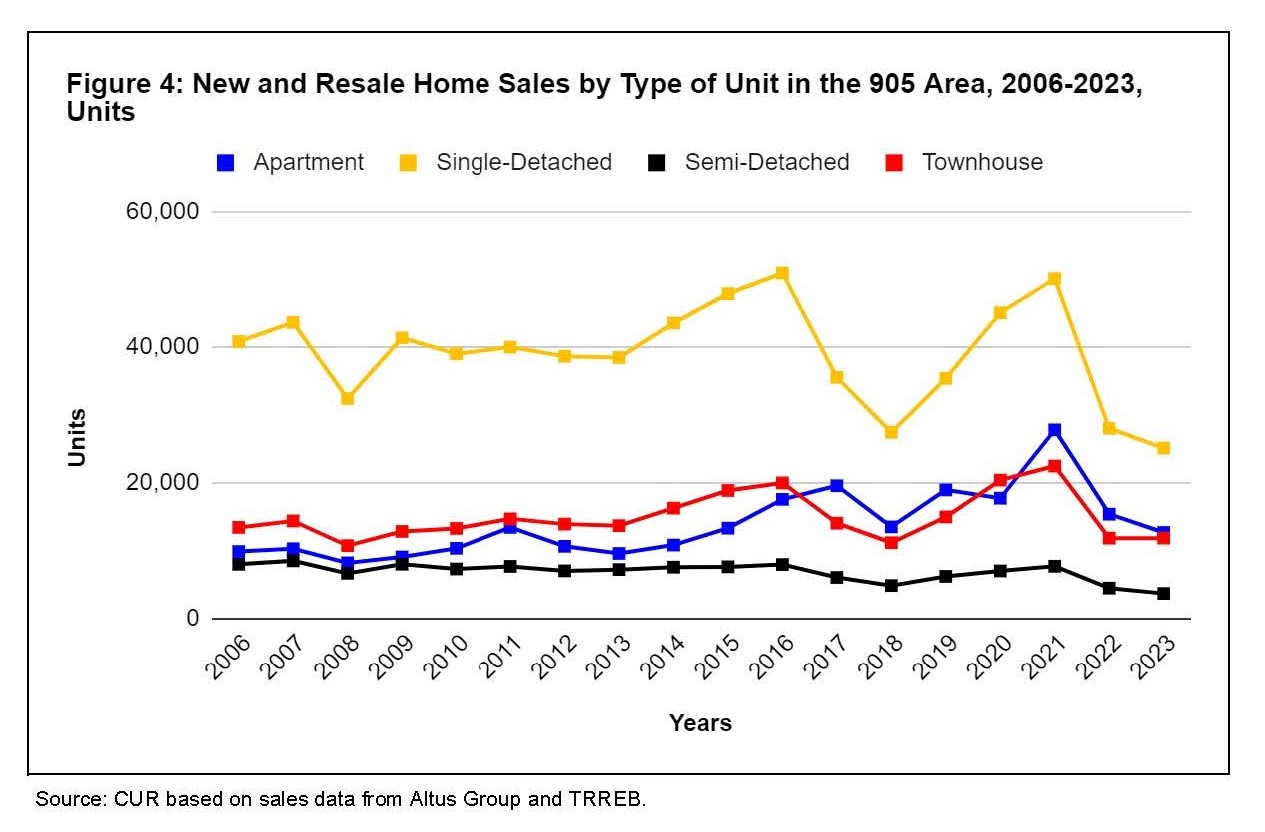
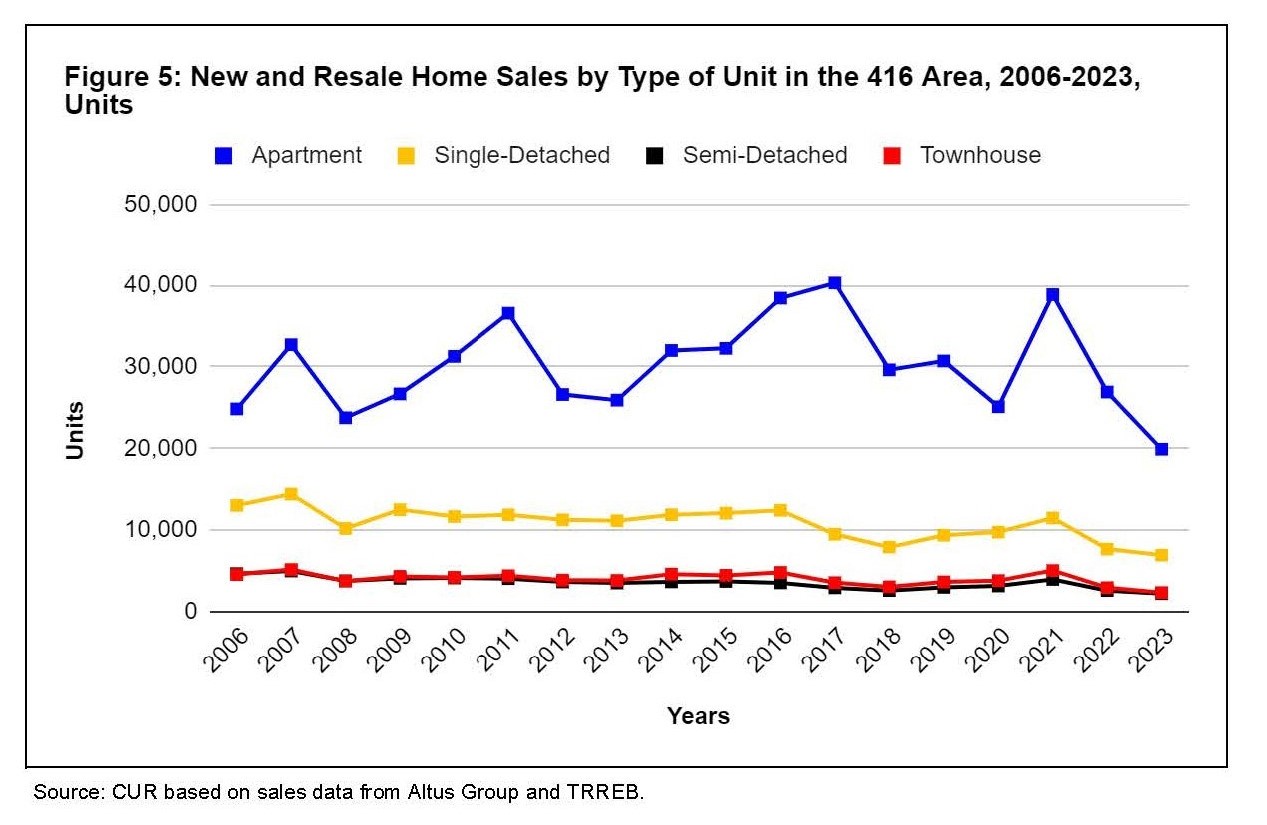
- The housing market roles differ markedly for the 905 and 416 areas, with single-detached house sales being most prevalent in the 905 area and condo apartments in the 416 area.
- Actions to improve housing affordability are more likely to be successful if undertaken for the housing market area as a whole (e.g., the GTA, not solely the city of Toronto).
Background
Much attention is paid to housing market developments in the city of Toronto (the 416 area) on the mistaken assumption that the city itself represents a singular housing market area. It does not. The city is intrinsically part of the large urban region known statistically as the Toronto census metropolitan area (CMA) and commonly referred to as the Greater Toronto Area (GTA)1. Actions to improve housing affordability are more likely to be successful if undertaken for the housing market area as a whole (e.g., the GTA, not solely the city of Toronto).
While municipalities like Toronto control their land supply for housing by location, density, and unit type, they have little say in where households decide to live and the type of housing they occupy. The housing market is regional in scope, encompassing a large labour market area where most residents live and work.
This reality is evident in the sizable net outmigration of Toronto residents to other parts of the province (51,508 persons in the 12 months ending July 1, 2023). Indeed, with the lack of affordable lower-density housing types in Toronto and other parts of the GTA, the housing market area has spilled beyond the GTA boundaries (a net outflow of 98,600 persons to other parts of the province).2
This blog examines total home sales (both resale and new) in the city of Toronto (the 416 area) vs. other parts of the GTA (the 905 area) by year from 2006 to 2023.3 It documents the importance of the 905 area in the GTA housing market and the differing roles these two areas play in the overall regional housing market area.
The main text examines combined new and resale home sales. In the appendix, new and existing home sales are presented separately for the GTA and the 905 and 416 areas.
The Housing Sales Data
The sales database includes sales reported by the Toronto Regional Real Estate Board (TRREB) and Altus Group. The TRREB sales include all sales under the auspices of the Multiple Listing Service (MLS). Most existing home sales (resales) are covered by the TRREB data. Altus Group provides new home sales through a monthly survey.
All sales are included, whether for investors or owner-occupants. Typically, more investors purchase new condominium apartments.
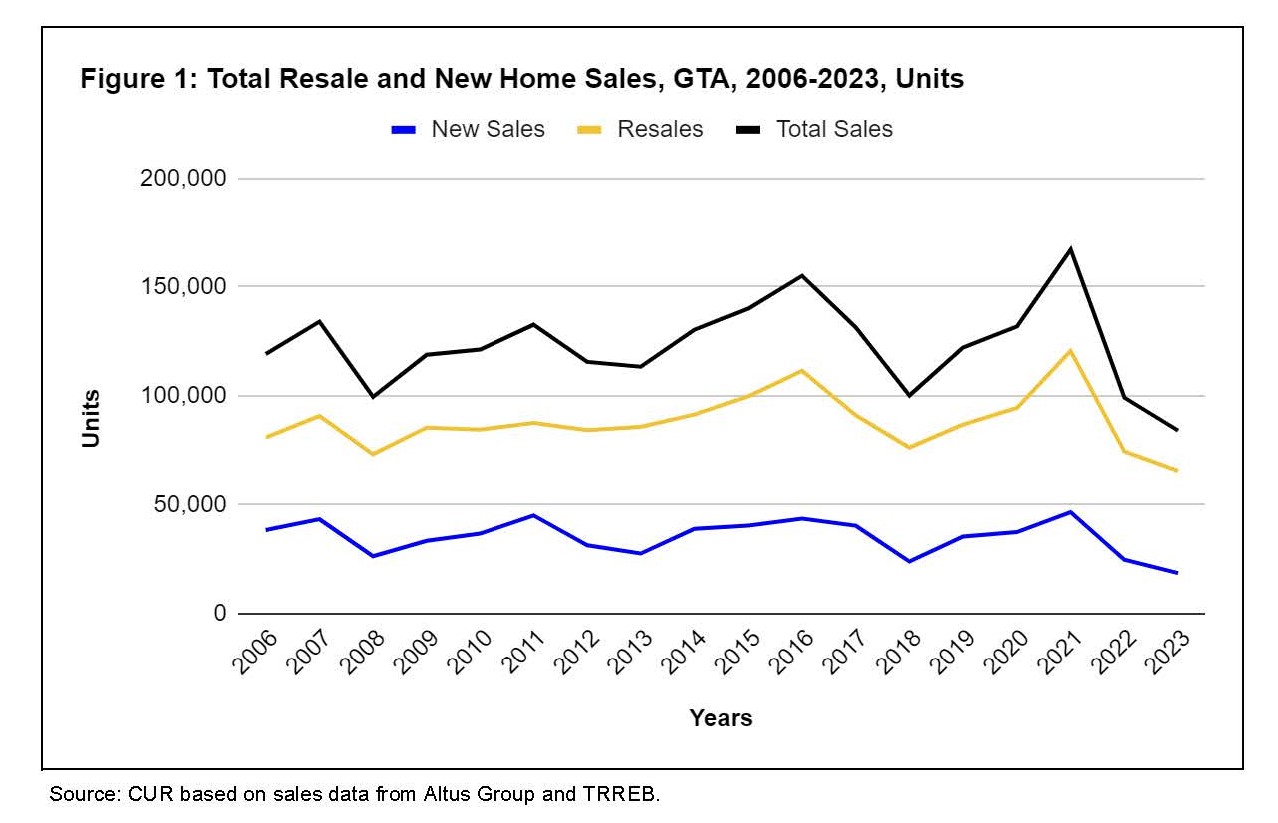
GTA home sales (existing and new) averaged 123,000 per year 2006-2023. Sales were relatively flat over this period. Sales include purchases by owner-occupants and investors. 75% of all sales were of existing homes.
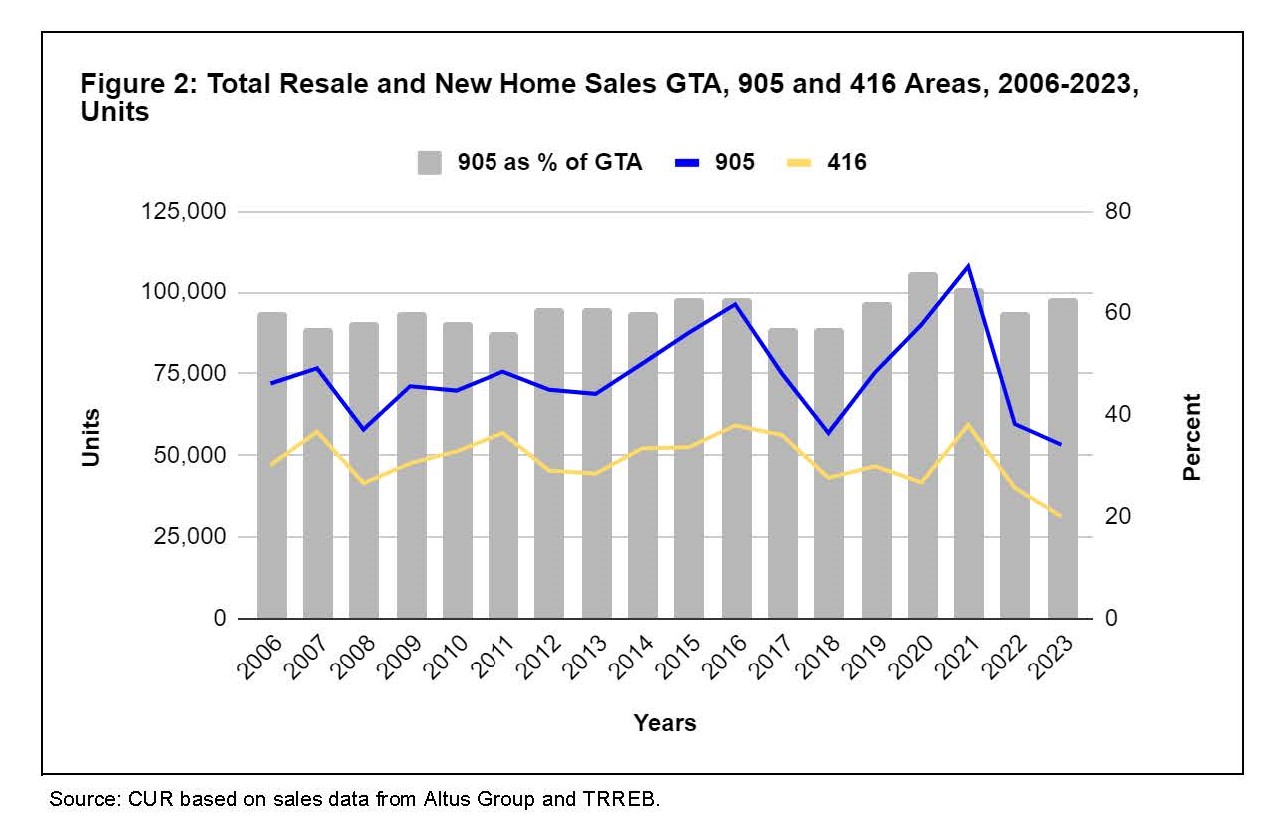
On average, 61% of GTA sales were in the 905 area, with 39% in the city of Toronto. While the 905 proportion was relatively stable from 2006 to 2023, it did see a peak during the pandemic, before falling back to historical norms.
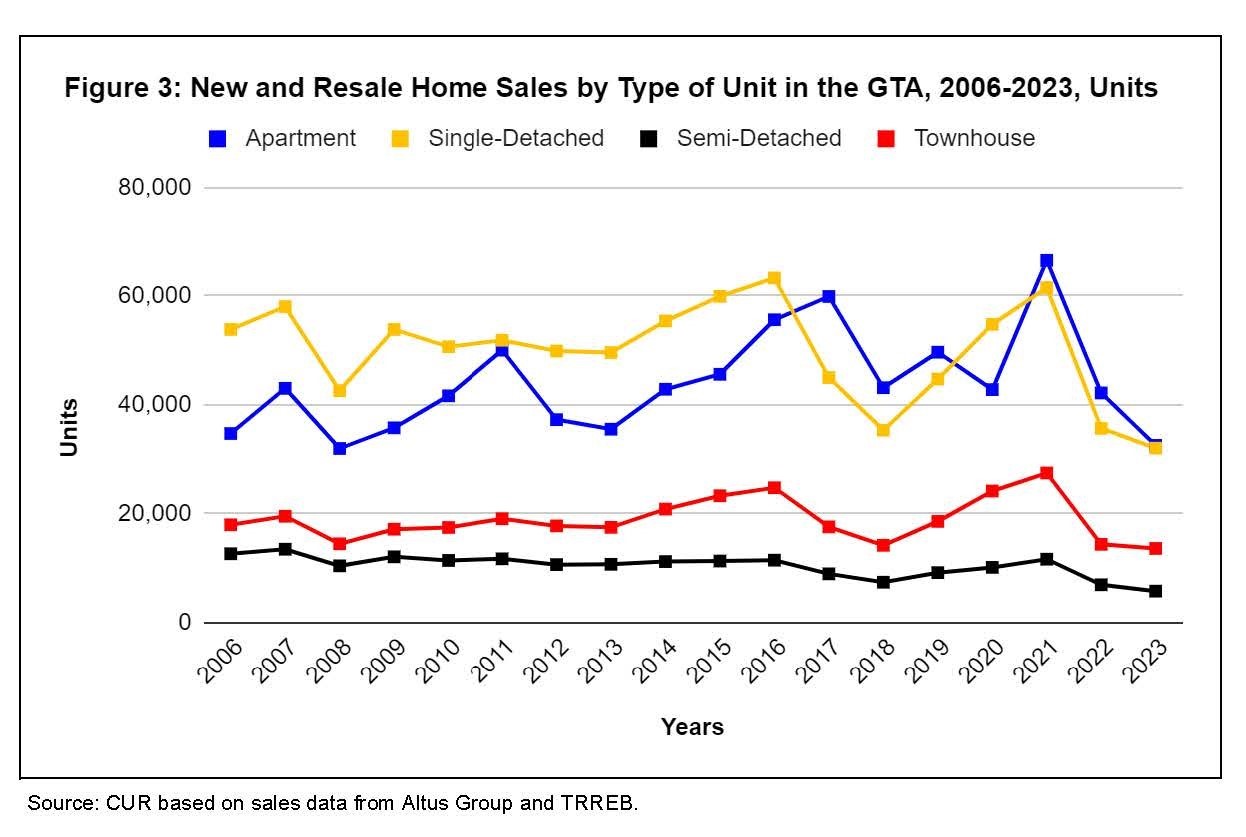
GTA single-detached home sales outpaced apartments from 2006 to 2016, with apartments only catching up post 2016.
Single-detached houses led sales in the 905 area during 2006-2023.
In contrast, condo apartments topped sales in the 416 area over the same period.
Concluding Comments
The housing roles of the city of Toronto (416 area) and the 905 regions constituting the GTA have varied historically, with Toronto recording many more condominium apartment sales and the 905 area many more single-detached sales. Townhouse and semi-detached home sales have lagged the predominant unit type in both areas.
While apartments will continue to dominate home sales in Toronto, the planning aspiration is that a growing share of apartment additions to the housing stock will be lower-rise in the form of new duplexes, triplexes, quadruplexes, stacked townhouses and garden apartments. High-rise apartment structures have been the primary apartment form over the past quarter century.
Similarly, the new housing stock in the 905 area as planned should continue broadening from mostly single-detached houses to more townhouses, duplexes, stacked townhouses, and various other forms of apartment structures, including mid-rise and high-rise buildings. This is consistent with the need to provide a range of housing types and locations for home purchasers.
End Notes
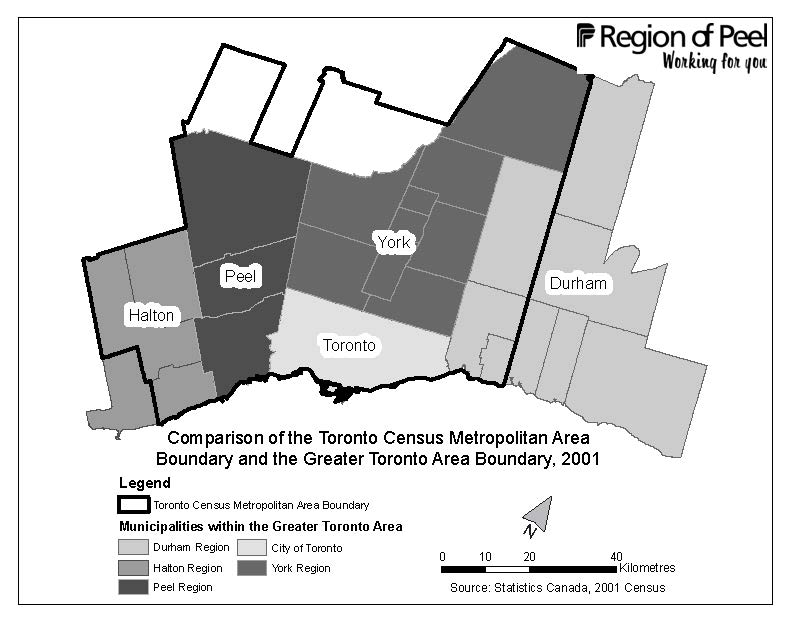
[1] A map at the end compares the boundaries of the GTA and the Toronto CMA. The ‘905’ boundary in the TRREB sales data extends beyond the GTA boundaries (e.g., southern Simcoe County). The 2023 populations for the GTA and the Toronto CMA are almost identical.
[2] Frank Clayton. Residents Fleeing the City of Toronto, Peel and York Regions to Find More Affordable Homes. CUR. June 18, 2024.
[3] A prime objective of the Growth Plan for the Greater Golden Horseshoe under the Liberal Government was to shift the mix of new housing away from single-detached homes on greenfield lands to more dense housing forms in built-up urban areas.
References
Frank Clayton. (2024). Residents Fleeing the City of Toronto, Peel and York Regions to Find More Affordable Homes. CUR. [Available Online]: (PDF file) https://www.torontomu.ca/content/dam/centre-urban-research-land-development/BLOG/blog87/CUR_Blog_Intraprovincial_Migration_Flows_June_18_2024_final.pdf
Appendix A: Separated New and Resale Sales in the GTA
Four appendix figures disaggregate the combined sales data in Figures 4 and 5 into their components: MLS sales and new home sales by unit type and area.
New Home Sales
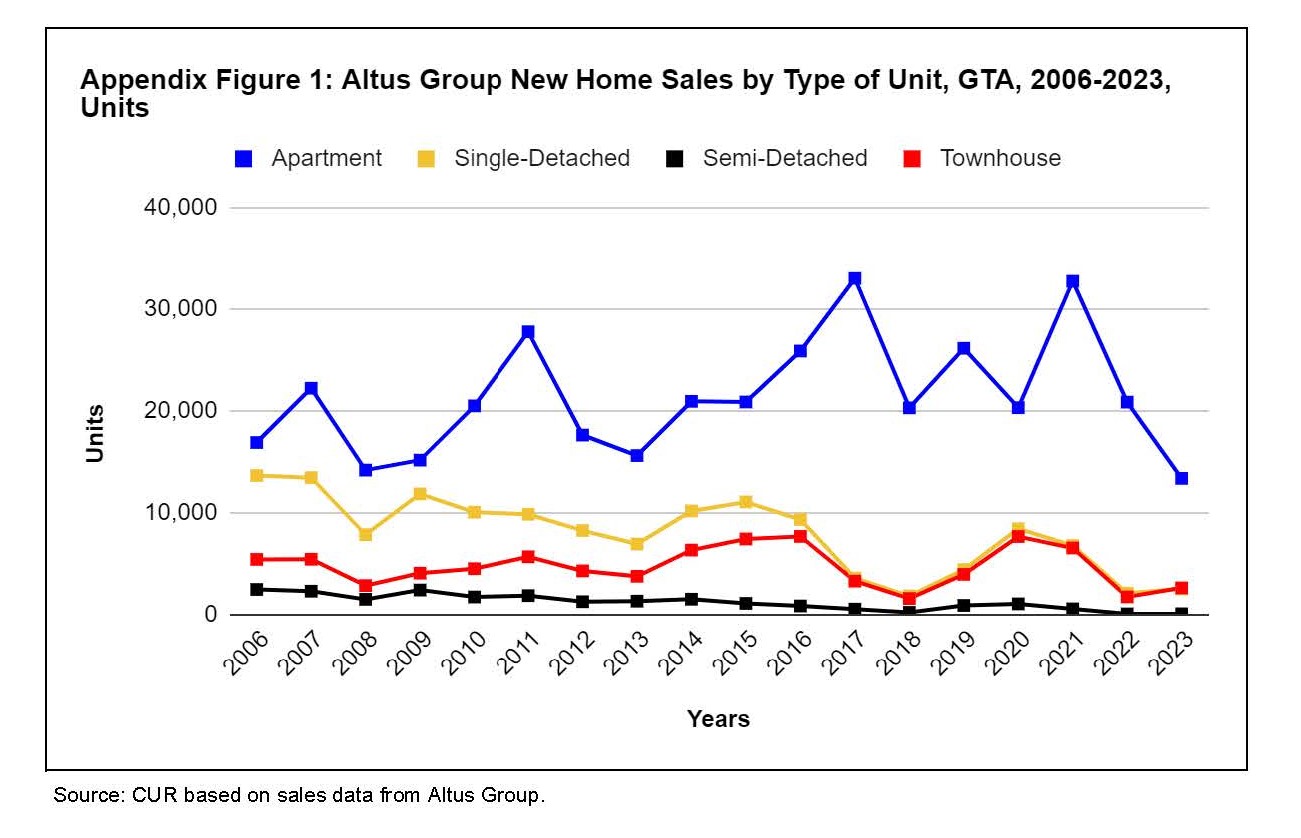
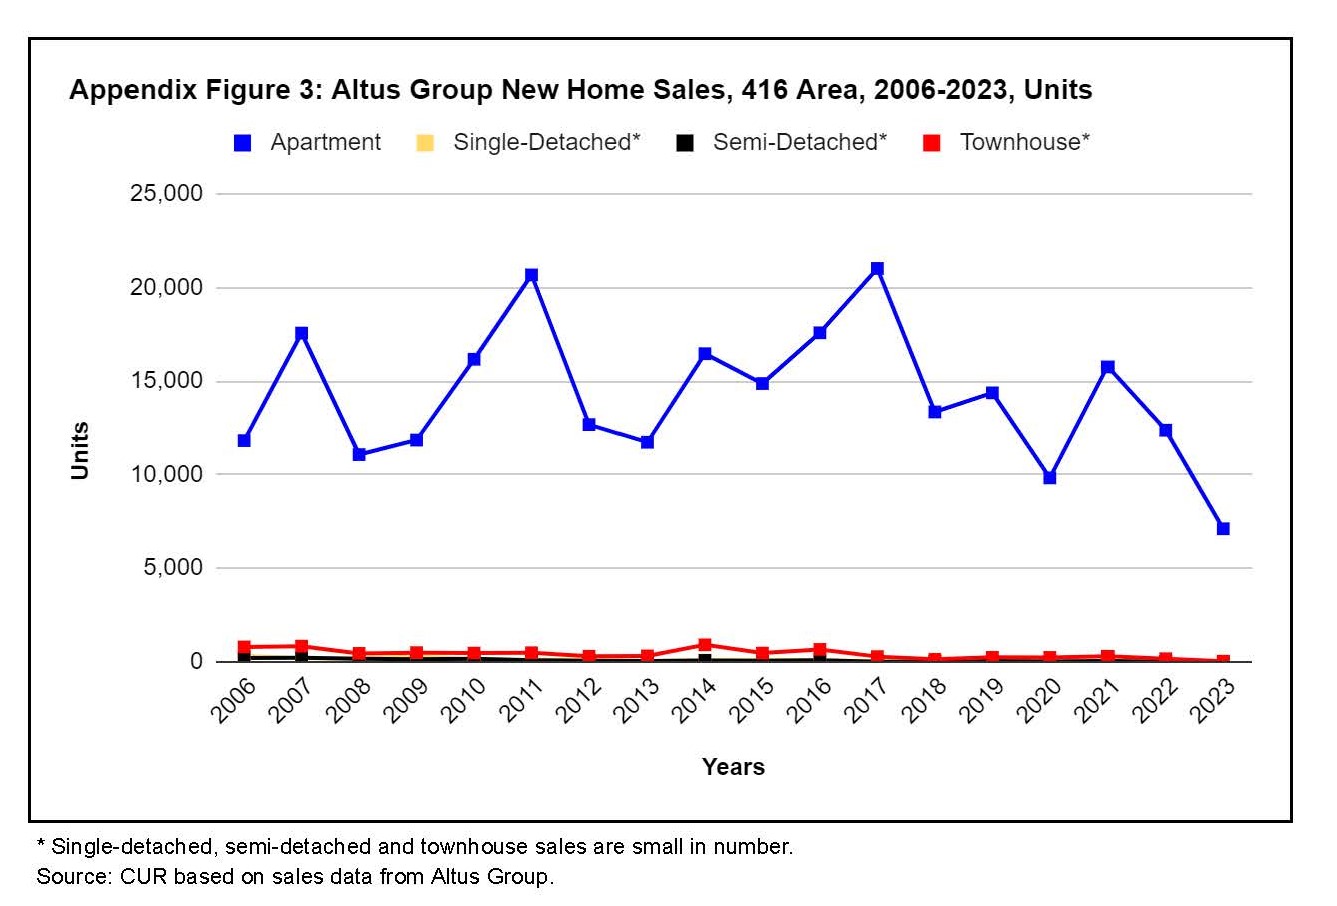
Apartment sales dominate new home sales in the GTA – single-detached houses declined through 2006-2023, reaching their lowest numbers in 2022 and 2023 – townhouses and semi-detached home starts failed to counter the long-term decline in single-detached house sales.
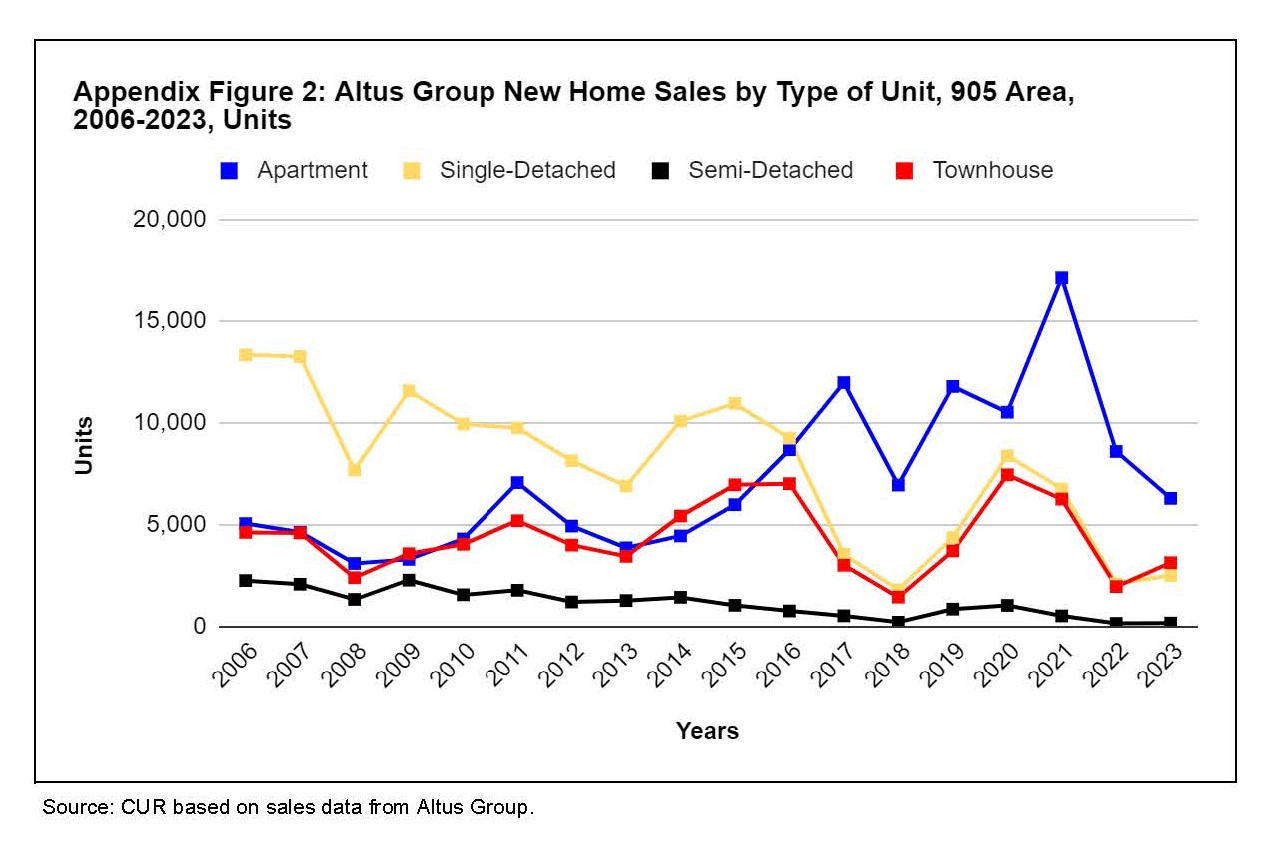
In the 905 area, while single-detached houses dominated new home sales from 2006 to 2015, but then lagged apartments – the long-term decline in single-detached house sales was not replaced by higher sales of townhouses or semi-detached homes.
During 2006 to 2023, virtually all new homes sold in Toronto were apartments.
MLS Resales
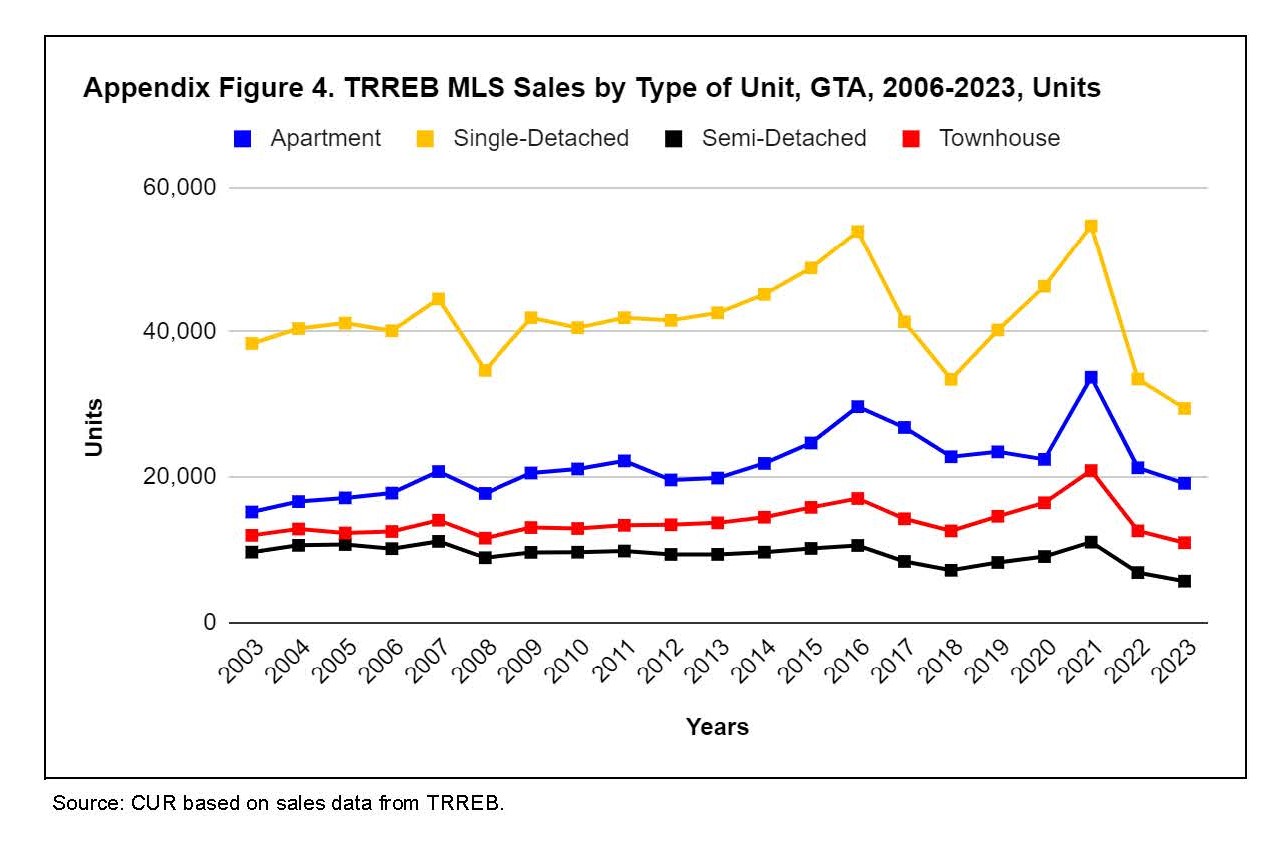
Single-detached homes were the most significant component of MLS sales in the GTA throughout 2006-2023.
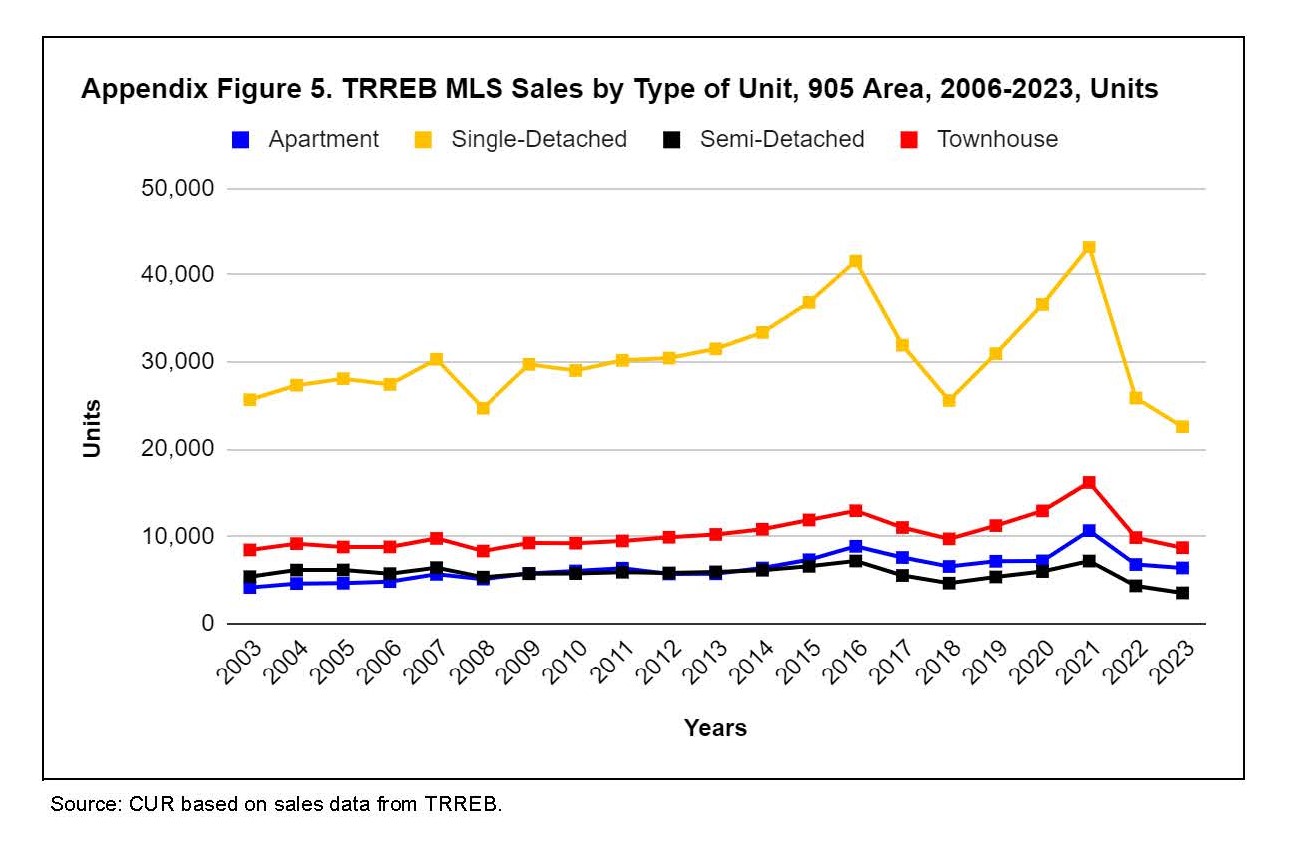
Single-detached homes accounted for the bulk of MLS sales in the 905 area.
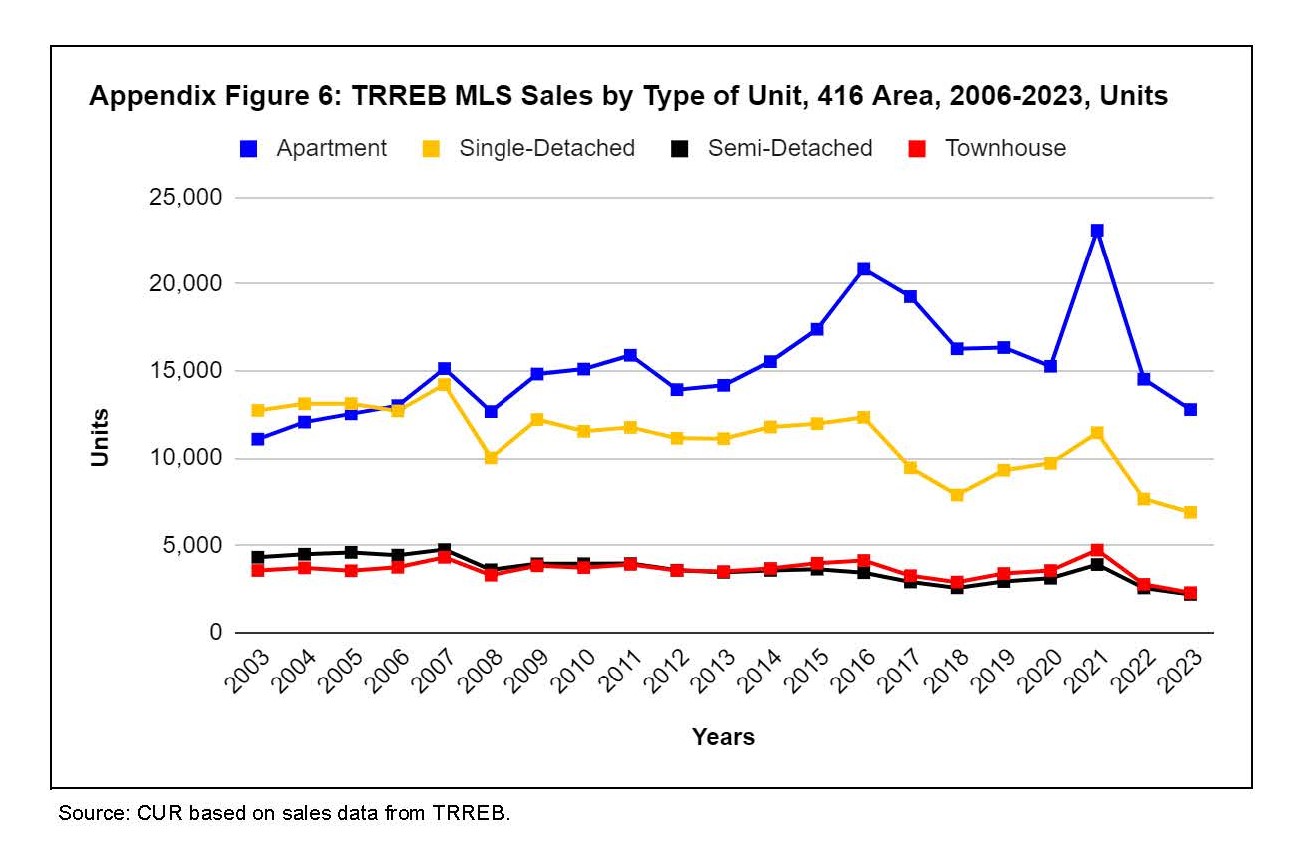
In the city of Toronto, condominium apartments superseded single-detached homes as the single largest category of existing home sales.
Appendix B: Map Showing GTA and Toronto CMA Boundaries
