Residents Fleeing the City of Toronto, Peel and York Regions to Find More Affordable Homes
By: Frank Clayton, Senior Research Fellow, with research assistance from Yagnic Patel
June 18, 2024
(PDF file) Print-friendly version available
Executive Summary
This blog examines Statistics Canada’s latest estimates of net intraprovincial migration flows between Ontario census divisions (municipalities) in 2023 and the six preceding years. Net intraprovincial migration refers to the net flow (inflow less outflow) of Ontario residents between municipalities in the province. A quest for more affordable housing plays a significant role in the movement of residents between municipalities before, during and after the COVID-19 pandemic.
Key findings:
- The number of Ontarians moving between municipalities (CDs) accelerated during the pandemic and remained high in the 12 months ending July 1, 2023.
- Three municipalities in the Greater Toronto Area (GTA) accounted for 100% of the net outflow of residents within the province in the 12 months ending July 1, 2023 – the city of Toronto (51,508); Peel region (40,934); and York region (6,249) for a total net outflow of 98,600 persons.
- In contrast, the net inflow of residents within the province was much more dispersed – the three top recipients were Greater Golden Horseshoe (GGH) municipalities: Simcoe county (12,782), Durham region (10,416) and Niagara region (8,213). They accounted for just 32% of the province’s intraprovincial migration in 2023.
It is anticipated that the continued dispersal of the residents of the GTA - particularly those residing in Toronto, York, Peel, and Halton - will occur as they search for the type and price of housing they can afford elsewhere in the GGH and other parts of the province.
Background
Statistics Canada (StatCan) recently released population estimates as of July 1, 2023, for census divisions (CDs) across Canada. The agency prepares these estimates annually. The estimates are revisited following each quinquennial Census of Canada. In this case, the previously released estimates for 2017-2022 have all been rebased following the 2021 Census of Canada.[1]
StatCan also prepares estimates of the components of the population change:
- Natural increase: births less deaths;
- Net international migration: immigration less emigration;
- Net interprovincial migration: persons moving between provinces;
- Net intraprovincial migration: persons moving between municipalities within the same province.
This blog focuses on population change in the 12 months ending July 1 of the years considered (the 12 months ending July 1, 2023, are referred to as 2023).
We also label CDs as municipalities (the terms are used interchangeably here). In Ontario, most CDs are large single-tier municipalities (like the cities of Toronto, Ottawa, or Hamilton), regional municipalities (like the regions of York, Durham, or Waterloo) or counties (like Simcoe or Wellington counties). The county population estimates include separated municipalities within their borders (Wellington county includes the city of Guelph).
Much attention has been focused on the surge in immigration into Canada and where new immigrants locate. Immigration is now the primary source of population increase in many municipalities. Less attention is paid to the migration patterns of Ontario residents and the factors behind them, especially for residents moving between municipalities within larger urban regions.
This blog examines net intraprovincial migration flows between Ontario municipalities (census divisions) in 2023 and the six preceding years. Net intraprovincial migration refers to the net flow (inflow less outflow) of Ontario residents between municipalities.
There are two appendix tables providing data for all CDs in Ontario:
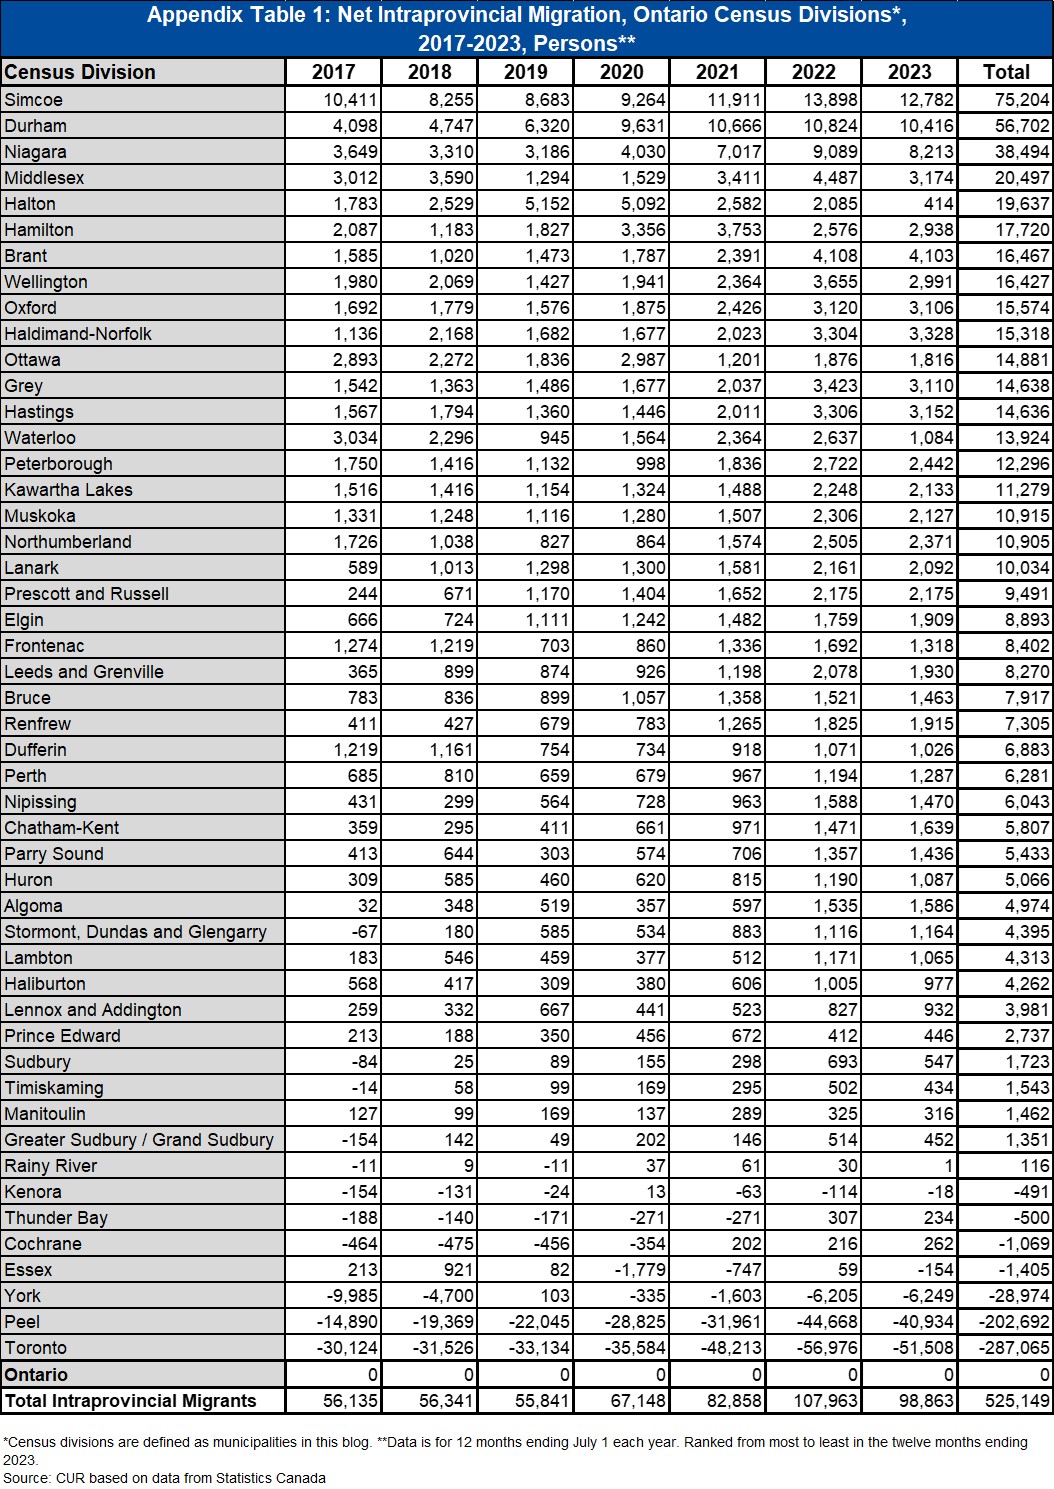
- Appendix Table 1: Net Intraprovincial Migration by CD, 2017-2023
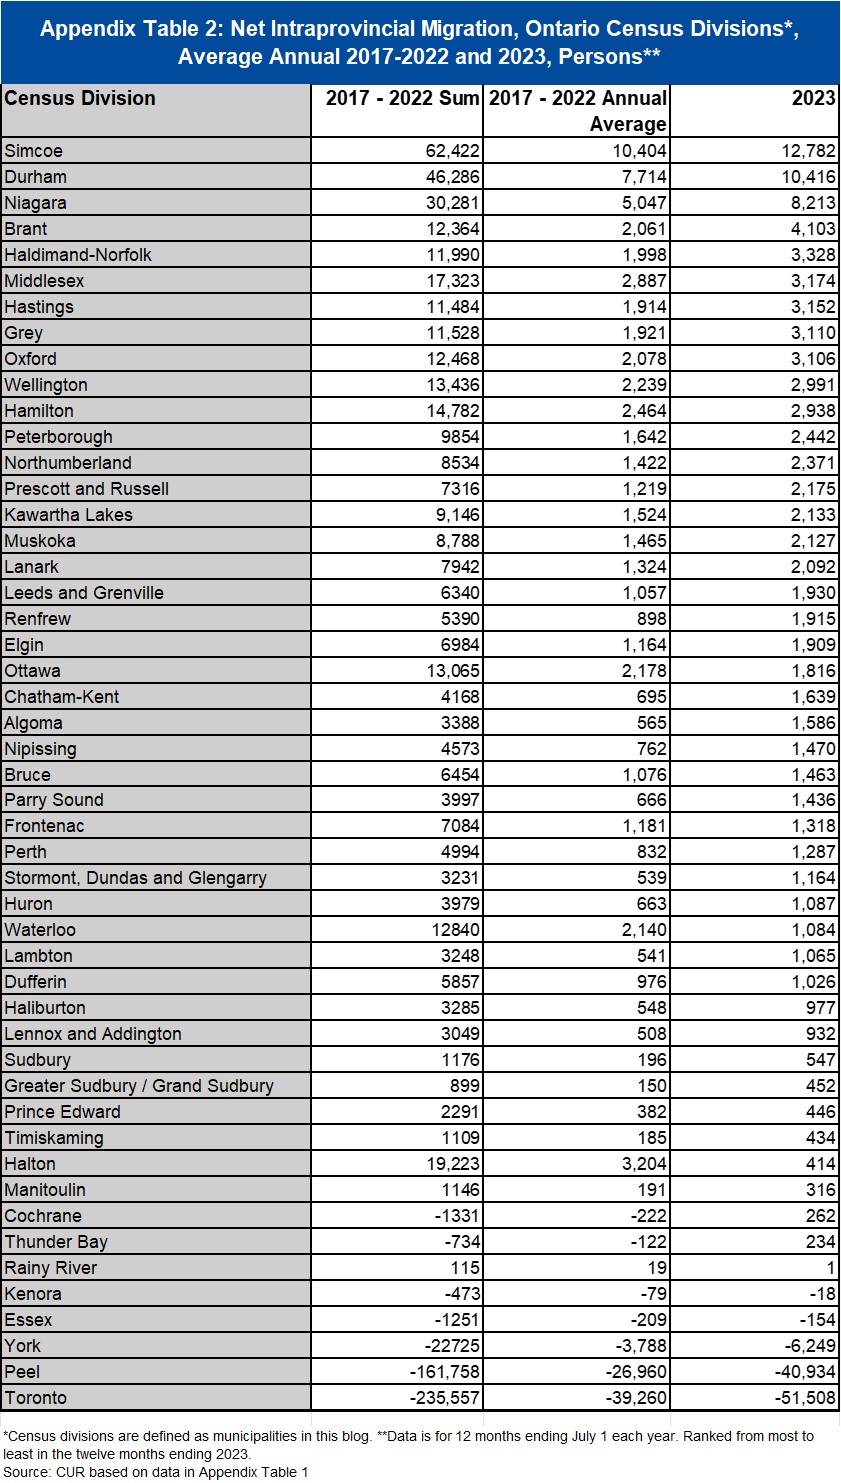
- Appendix Table 2: Net Intraprovincial Migration by CD, Average Annual 2017-2022 and 2023
Pronounced increase in Ontarians moving between municipalities during the pandemic
Looking at the number of residents moving between municipalities (CDs) in the province between 2017 and 2023 provides insights into the effect of the COVID-19 pandemic on population movement. Bank of Canada research in 2022 found a narrowing gap between housing prices in central cities and their suburbs in 2020-2022, consistent with a preference shift to more living space.[2]
The number of Ontario residents moving between municipalities supports shifting housing demand during the pandemic.
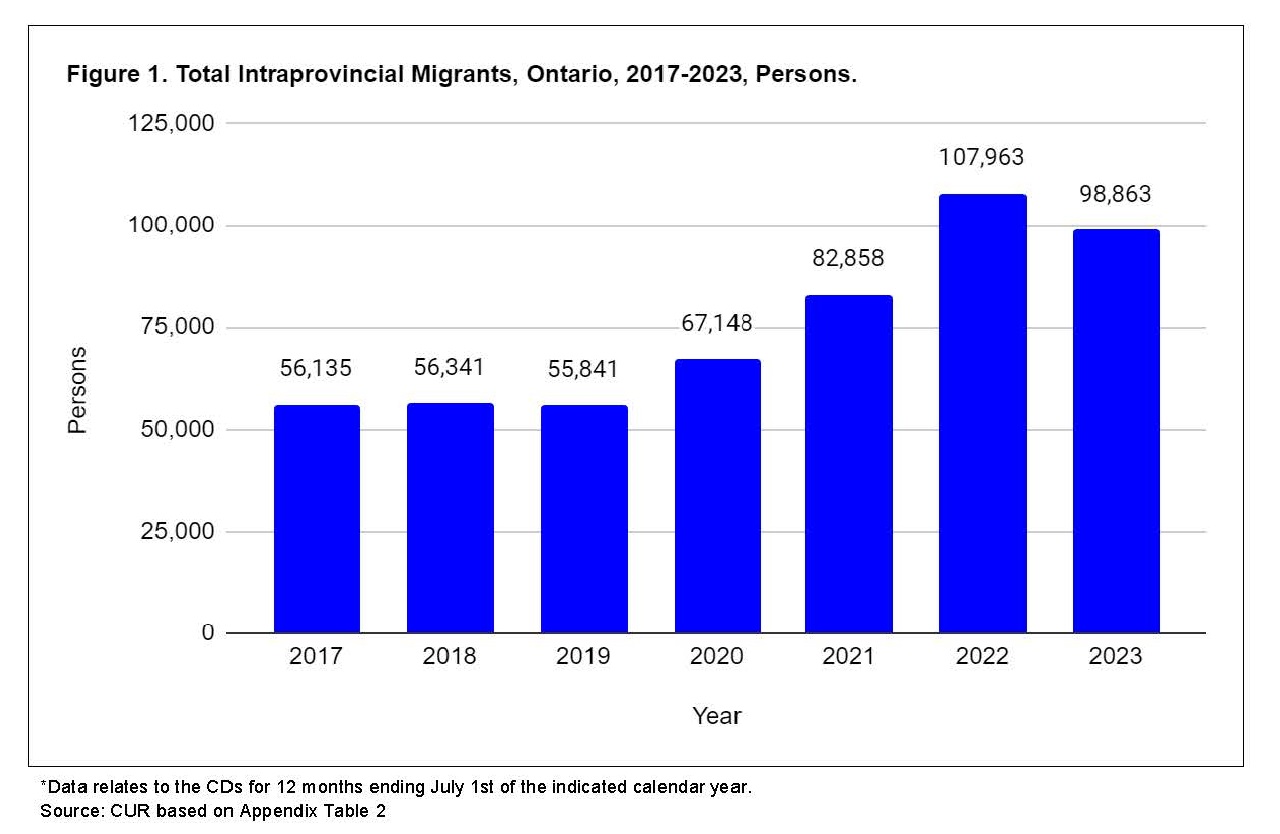
Figure 1 shows the total number of Ontarians moving between municipalities from 2017 to 2023.
Highlights:
- The number of intraprovincial migrants across the provinces was stable at about 56,000 persons in 2017-2019, before the pandemic.
- Intraprovincial migration accelerated during the pandemic to 107,963 persons in the 12 months ending July 1, 2022.
- Intraprovincial migration moderated slightly in 2023 to 98,863 persons but remained much higher than in the years immediately before the pandemic.
Three municipalities in the Greater Toronto Area had a net loss of 98,600 residents to other parts of Ontario in 2023
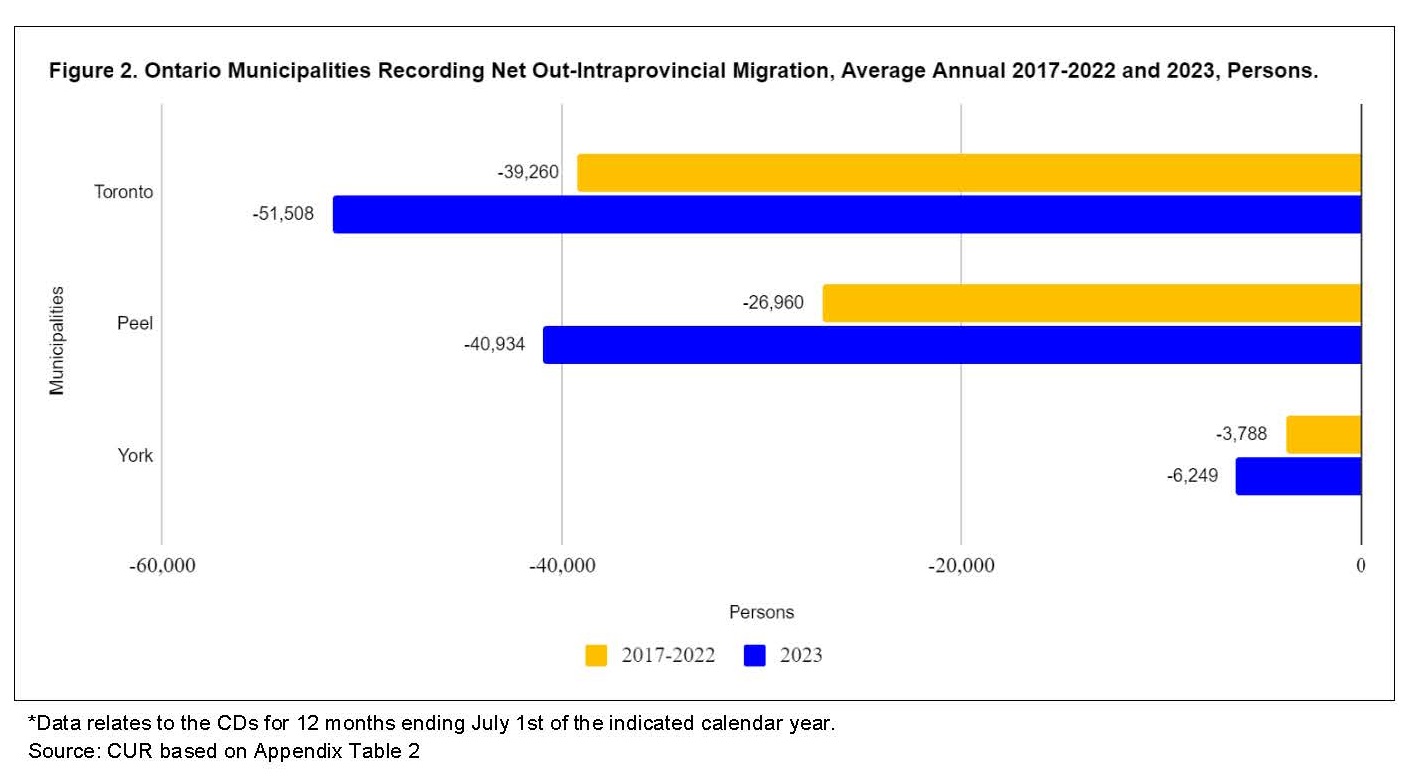
Figure 2 focuses on the municipalities experiencing a negative net interprovincial migration in 2023.
Highlights:
- Only three out of 49 CDs (municipalities) recorded net outflows of resident population to other places in Ontario in 2023.
- The three population losers are all in the Greater Toronto Area (GTA) – the city of Toronto, along with Peel and York regions.[3]
- Two of these municipalities had sizable net outflows: the city of Toronto (51,508) and Peel region (40,934).
- York region, on the other hand, recorded a much smaller net outflow of residents (6,249).
- For all three municipalities, the 2023 net losses surpassed the average annual net losses of the previous six years. Yet, they were still less than in 2022 for the city of Toronto and Peel region (see Appendix Table 1).
Simcoe county, Durham, and Niagara regions experienced the largest net inflow of intraprovincial migrants in 2023
Figure 3 shows the top ten municipalities (CDs) exhibiting a net gain of interprovincial migrants in 2023.
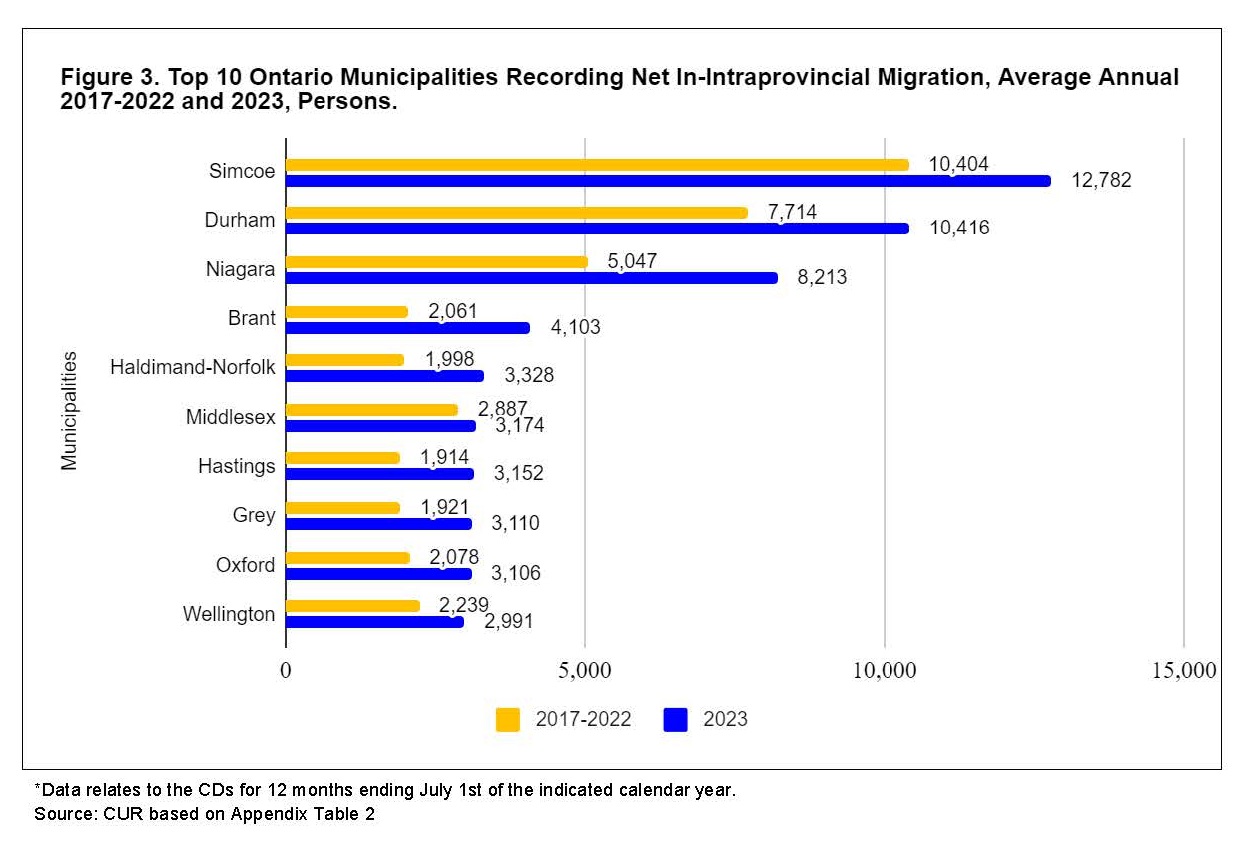
Highlights:
- Three municipalities – Simcoe county, Durham and Niagara regions – were the largest recipients of net intraprovincial migrants in 2023 - Simcoe county took the top spot with 12,782 net intraprovincial migrants in 2023, followed by Durham region (10,416) and Niagara region (8,213). All three municipalities have sizable greenfield land inventories for building ground-related homes.[4]
- While the losing municipalities were just three, the net intraprovincial gainers were spread throughout the province - The three top municipalities accounted for just 32% of all the net intraprovincial migrants. Since there are no detailed estimates of gross migration flows between individual municipalities, we can only surmise what is happening. Seven of the municipalities in Figure 2 are part of the Greater Golden Horseshoe (GGH). It appears the residents leaving the city of Toronto and Peel and York regions moved to other parts of the GTA and to outer municipalities in the GGH in search of more affordable ground-related homes, but some moved even farther afield. In turn, residents of many GGH municipalities moved from the region to other parts of the province for housing affordability reasons.
- Most of the top ten recipient municipalities had higher net in-migration in 2023 than the average annual of the six prior years - The exceptions included Halton and Waterloo regions and the city of Ottawa.
The lack of affordable homes likely contributes to the mounting net outflow of intraprovincial migrants from the GTA
The worsening affordability of housing within the GTA is an important reason for the rising GTA net migrant losses during the past seven years. On the demand side, surveys conducted by Ipsos for the Toronto Regional Real Estate Board continually show that about 80% of all likely GTA homebuyers state they are most likely to purchase a ground-related home (55-60% a single-detached or semi-detached house).
The bottom line is that we anticipate the continued dispersal of the residents of the GTA, particularly those residing in Toronto, York, Peel and Halton, as they search for the type and price of housing they want elsewhere in the GGH and other parts of the province.
End Notes
[1] The source of the data utilized in this blog is listed at the end of the text.
[2] As summarized in a CUR blog, Frank Clayton. Narrowing the Housing Price Gap Between the Suburbs and Downtown Toronto: Demand or Supply Driven in the Future? September 15, 2024.
[3] The Greater Toronto Area (GTA) consists of the city of Toronto and the regions of Durham, York, Peel and Halton.
[4] Ground-related homes include single- and semi-detached houses and townhouses. With the affordability crunch, the housing mix on greenfield land is now encompassing forms of missing middle housing beyond townhouses (like stacked townhouses and garden apartments).
References
Frank Clayton. (2023). Narrowing the Housing Price Gap Between the Suburbs and Downtown Toronto: Demand or Supply Driven in the Future? CUR. Available Online]: (PDF file) https://www.torontomu.ca/content/dam/centre-urban-research-land-development/BLOG/blog71/CUR_Narrowing_the_Housing_Price_Gap_Between_Suburbs_and_Downtown_Toronto_Spt._2022.pdf
Statistics Canada. Table 17-10-0153-01 Components of population change by census division, 2021 boundaries (external link)
Appendices