Toronto Tops in 2023 Population Growth in Canada and the United States
By: Frank Clayton, Senior Research Fellow, with research assistance from Yagnic Patel
June 10, 2024
(PDF file) Print-friendly version available
Executive Summary
It is extraordinary how Canadian central cities and metropolitan areas outperformed their American counterparts in population growth in the 12 months ending July 1, 2023. Toronto, both the central city and the metropolitan area[1], left U.S. counterparts far behind with growth of 125,756 and 221,588 persons, respectively. The closest American jurisdictions were the city of San Antonio (population increase of 21,970 persons) and the Dallas metropolitan area (growth of 152,598 persons).
Highlights between the two countries concerning population growth in the 12 months ending July 1, 2023, include:
- Eight of the top ten fastest-growing central cities are in Canada;
- Each country had five of the ten fastest-growing metropolitan areas;
- All nine of the major central cities losing population are in the United States;
- Several metropolitan areas in the United States lost population in 2023, most notably Los Angeles and New York City, whereas none of Canada's 48 metropolitan areas lost population.
The disparity in urban growth patterns between the two countries is nothing new. What is surprising is the lack of awareness south of the border of how rapidly Toronto is becoming an economic powerhouse mainly built on robust immigration from many countries. At the time of the 2021 Census of Canada, 49% of the Toronto metropolitan area's population was born outside Canada.
Background
This blog compares population growth in Canada's major central cities and metropolitan areas in 2023 with those south of the border. Population growth is based on population estimates prepared by the U.S. Census Bureau and Statistics Canada as of July 1, 2022, and July 1, 2023 (herein referred to as 2022 and 2023).[2] For brevity, the full names of several metropolitan areas are shortened in the text.
Large central cities – What a difference the 49th parallel of northern latitude makes for growth
Top-growing central cities
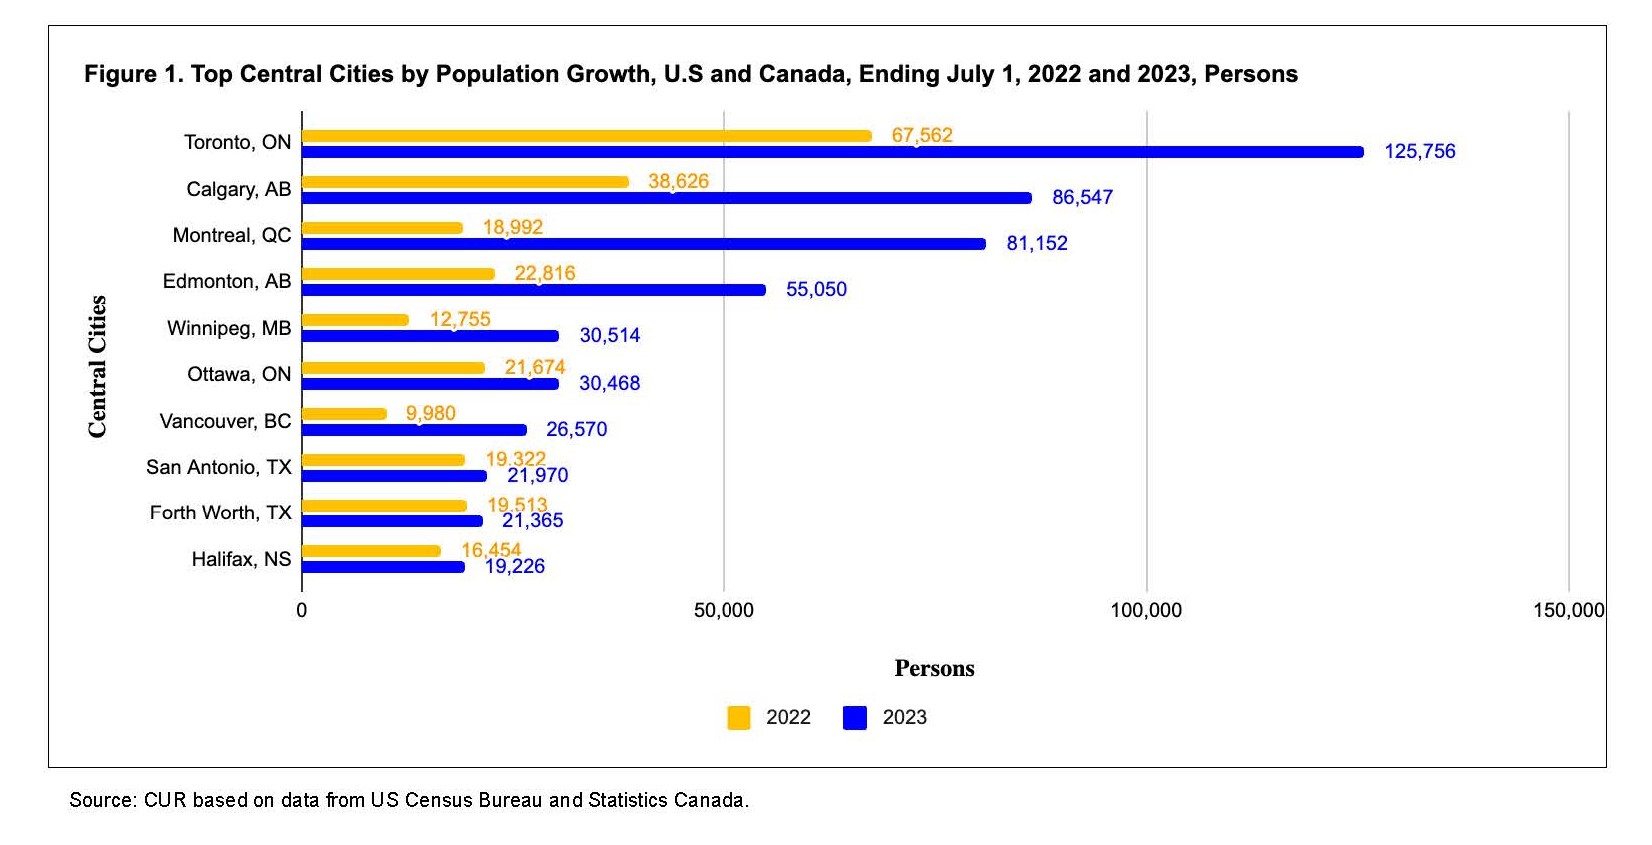
Figure 1 shows the central cities across the United States and Canada with the most population growth in 2023, along with 2022 data for comparison. The cities are ranked from highest to lesser growth in 2023 (the blue bars).
Highlights:
- Eight of the top ten fastest-growing central cities are in Canada - It is remarkable for a country with just 12% of the population of its neighbour to the south that eight of the ten top-growing central cities in the two countries are located in Canada.
- The city of Toronto added 125,756 persons to its population in 2023 – the top American city, San Antonio, added 21,970 - Toronto's growth results from a surge of immigration to Canada. Nearly a third of all immigrants settle in metropolitan Toronto, with the majority settling in the central city. The growth is even more extraordinary given that the city experienced a 2023 net loss of 51,500 residents to elsewhere in the province.
- The cities of Calgary, Montreal, Edmonton, Winnipeg, Ottawa and Vancouver also recorded population growth ahead of San Antonio - Three Canadian central cities other than Toronto recorded population growth in 2023 more than double San Antonio's – Calgary (86,547), Montreal (81,152) and Edmonton (55,050).
Central cities with the largest declines in 2023 population
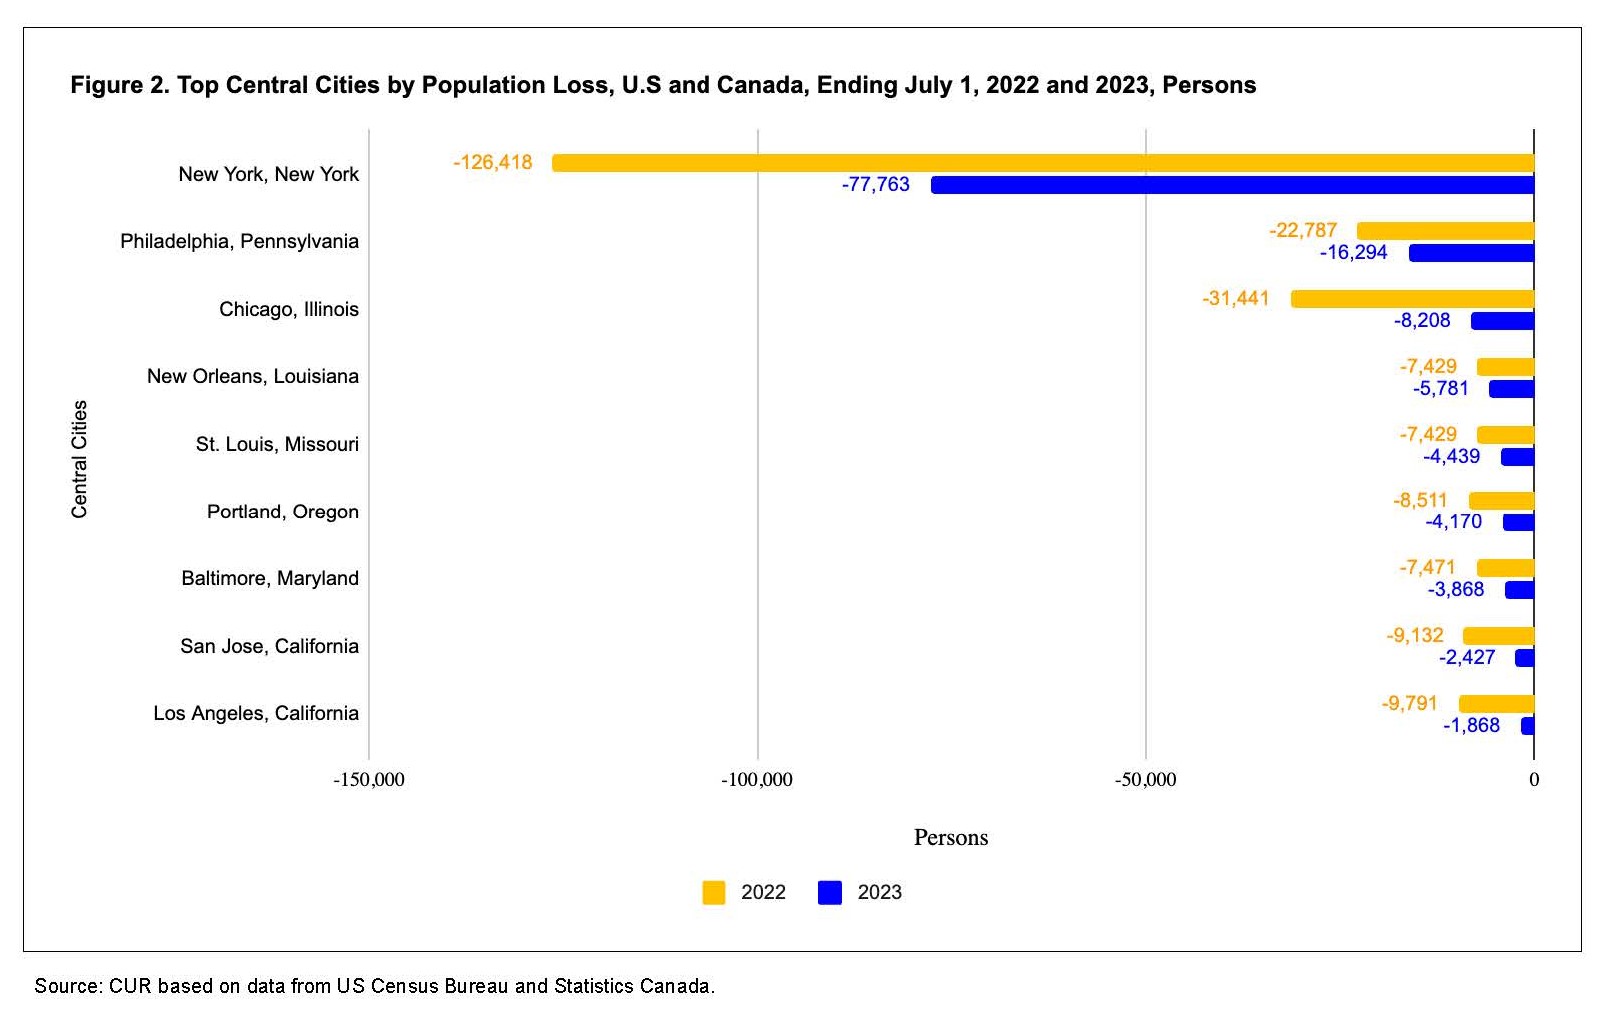
Figure 2 shows the central cities that experienced the most significant loss in population in 2023. The cities are ranked from the biggest to the smallest loss in 2023.
Highlights:
- All nine of the larger central cities with declines in population are situated in the United States - Another noteworthy difference between the central cities in the United States and Canada is that not a single larger central city in Canada recorded a net population loss in 2023.
- New York City recorded the most pronounced population decline, followed at a distance by Philadelphia and Chicago - New York City experienced a net loss of 77,763 residents, followed by Philadelphia (16,294) and Chicago (8,208). Notably, the population declines in all nine central cities were still considerably less than in 2022.
Impressive growth performance by Canadian metropolitan areas in 2023
Top-growing metropolitan areas
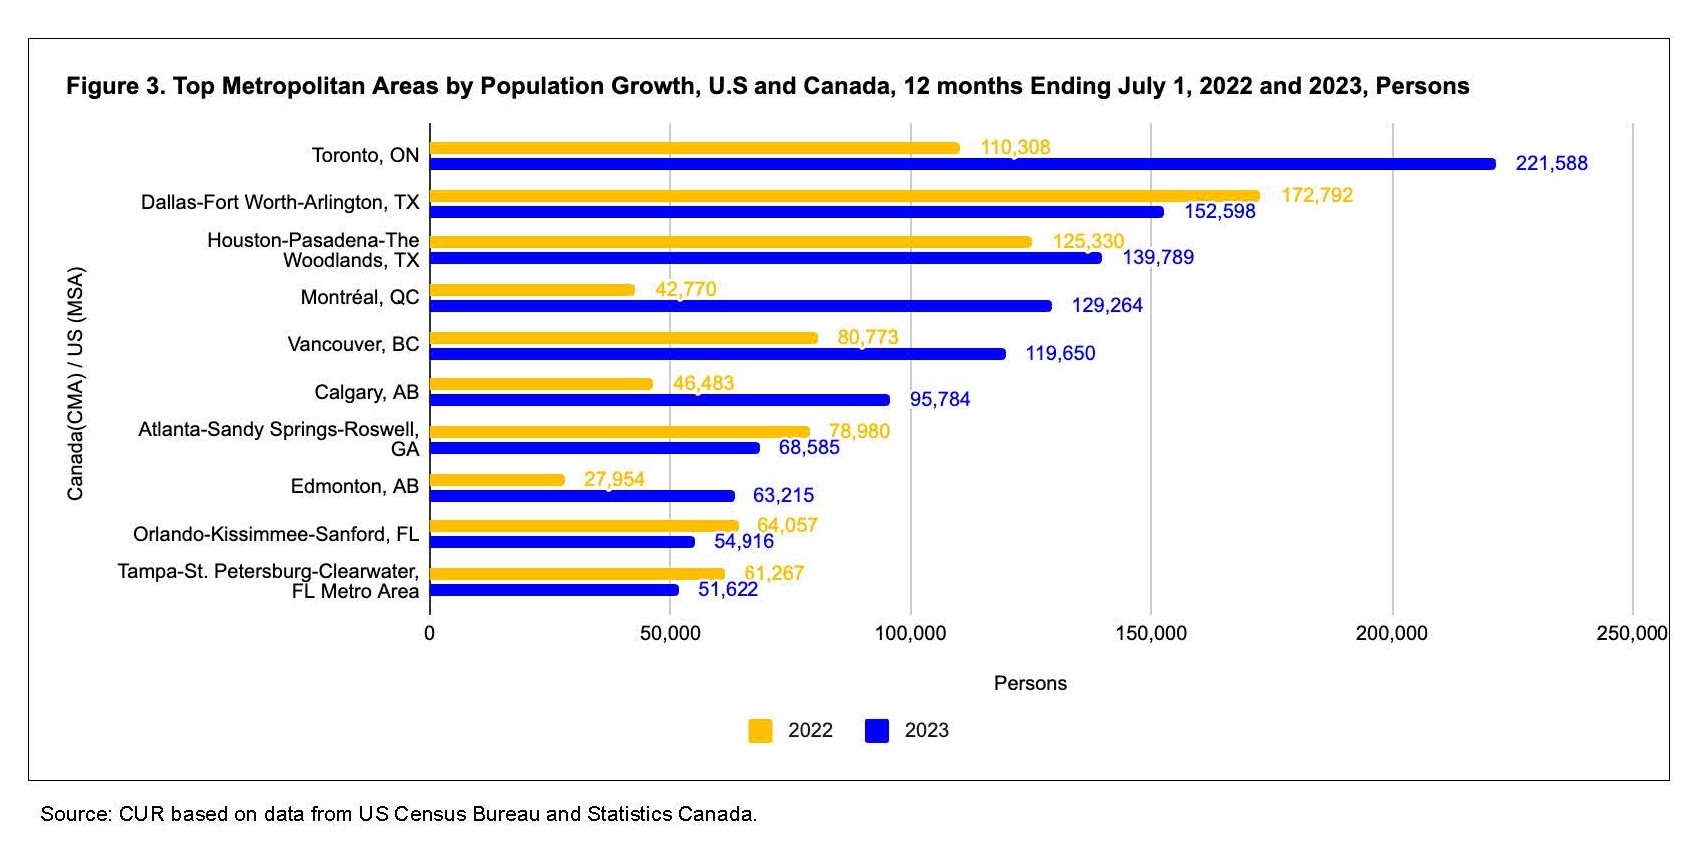
Figure 3 ranks the ten metropolitan areas in the United States and Canada by size of population growth in 2023.
Highlights:
- Metropolitan areas recording the most population growth in 2023 are evenly distributed between Canada and the United States - Each country had five metropolitan areas on the top ten list of fastest-growing metropolitan areas. Given the size differential between the two countries, Canada's performance remains impressive.
- Metropolitan Toronto's 221,588-person growth far exceeds Dallas's 152,598-person growth - In 2023, Toronto regained the crown for the fastest-growing metropolitan area in Canada and the United States. In 2022, Dallas was the metropolitan area with the greatest population increase.
- Three of the five metropolitan areas experiencing population growth of 100,000+ are in Canada - Houston (139,789), Montreal (129,264), and Vancouver (119,650) join Toronto and Dallas with robust population increases of 100,000 or more persons in 2023. Calgary was not far behind, with a growth of 95,784 persons.
Metropolitan areas with the largest population decline in 2023
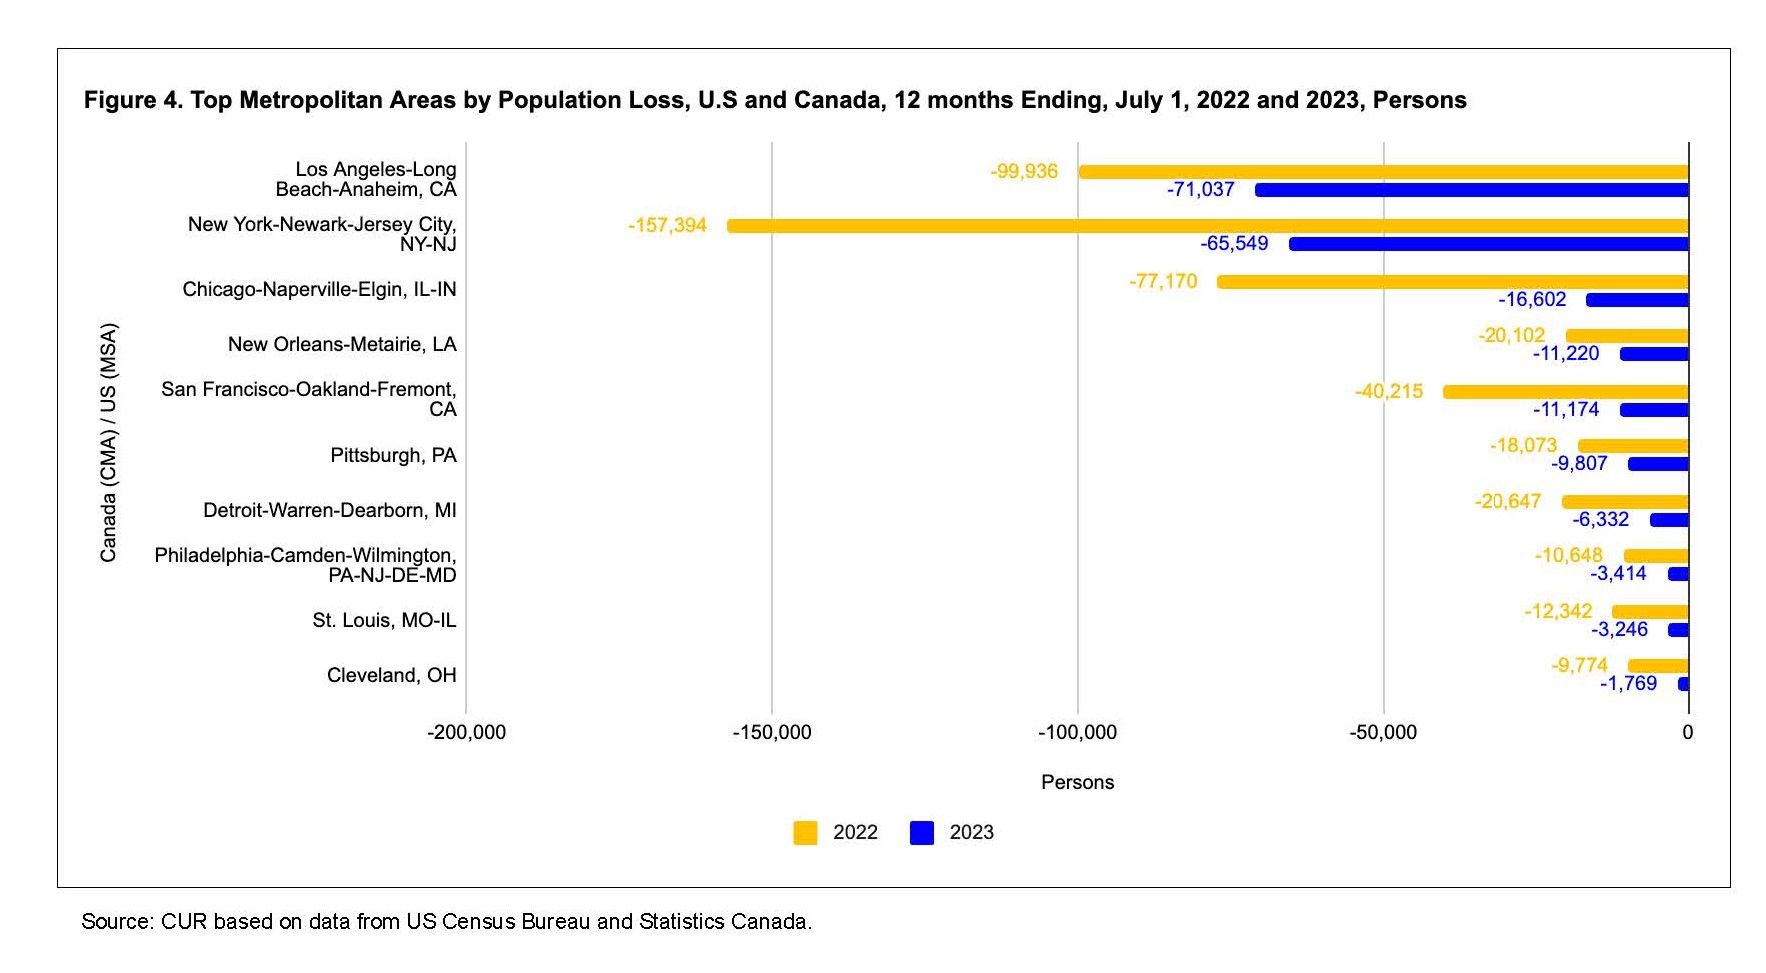
Figure 4 shows the metropolitan areas with the largest population losses in 2023.
Highlights:
- All ten of the metropolitan areas with the largest population losses in 2023 are American - On the contrary, none of Canada's 48 metropolitan areas experienced a decline in population in 2023.
- Metropolitan Los Angeles, New York and Chicago recorded the greatest population losses in 2023 - Los Angeles (71,037), New York (65,549) and Chicago (16,602) recorded the largest declines in their metropolitan population in 2023.
- Los Angeles' population loss was centred in parts of the metropolitan area outside of the central city - the reverse of New York and Chicago - For Los Angeles, the central city accounted for only 1,868 of the 71,037-person loss in the metropolitan area. For New York, the central city's loss of 77,763 persons was larger than the metropolitan area's loss of 65,549 persons. For Chicago, the decline was about equal for the central city (8,208) and other parts of the metropolitan area (8,394).
Endnotes
[1] The boundaries of the Toronto CMA extend from Milton and Oakville on the east, Orangeville, Mono, New Tecumseth, Bradford-West Gwillimbury, and Georgina on the north, and Uxbridge and Ajax on the east.
[2] The definition of metropolitan area is not the same in Canada and the United States. Generally, if the U.S. definition is applied to Canada, the total population and annual growth of its metropolitan areas would be higher than estimated. See the Appendix for brief descriptions.
References
Figures 1-2
Statistics Canada:
Statistics Canada. Table 17-10-0155-01 Population estimates, July 1, by census subdivision, 2021 boundaries (external link)
US Census:
Annual Estimates of the Resident Population for Incorporated Places of 20,000 or More, Ranked by July 1, 2023 Population: April 1, 2020 to July 1, 2023 (SUB-IP-EST2023-ANNRNK)
Source: U.S. Census Bureau, Population Division
Release Date: May 2024 https://www.census.gov/data/tables/time-series/demo/popest/2020s-total-cities-and-towns.html (external link)
Figures 3-4
Statistics Canada:
Statistics Canada. Table 17-10-0148-01 Population estimates, July 1, by census metropolitan area and census agglomeration, 2021 boundaries (external link) .
US Census:
Annual Estimates of the Resident Population for Metropolitan Statistical Areas in the United States and Puerto Rico: April 1, 2020 to July 1, 2023 (CBSA-MET-EST2023-POP)
Source: U.S. Census Bureau, Population Division
Release Date: March 2024 https://www.census.gov/data/tables/time-series/demo/popest/2020s-total-metro-and-micro-statistical-areas.html (external link)
Appendix: Defining Canadian and U.S. Metropolitan Areas
A Canadian Census Metropolitan Area (CMA) consists of one or more adjacent municipalities centred on a population center (the core). A CMA must have a population of at least 100,000, of which 50,000 or more must live in the core. The adjacent areas to the urban core are included in the CMA if 50% of the resident population commutes into the core for work and 25% of the jobs are filled by commuters from the core or the municipality directly touches or is partly within the urban core.
A U.S. Metropolitan Statistical Area (MSA) includes a central county with at least 50% of its population living in an urban core with a population of 50,000 or more. Surrounding counties are included in the MSA if 25% of the resident population commutes into the central county(ies) for work and 25% of the jobs are filled by commuters from the central county(ies).
Because of the varying definition, U.S. MSAs tend to be larger in geography and population than Canadian CMAs.
