Percent Increase in GO Passenger Trips Three Times the TTC in the First Quarter, 2024 According to Statistics Canada
By: Frank Clayton, Senior Research Fellow, with research assistance from Yagnic Patel
June 7, 2024
(PDF file) Print-friendly version available
Executive Summary
In February of this year, Statistics Canada (StatCan) began releasing monthly transit ridership data for selected urban transit agencies, along with comparable data for 2023, as part of its Monthly Passenger Bus and Urban Transit Survey. Previously, passenger trip data was only available for aggregations of provinces. We have organized these transit agencies by census metropolitan area (CMA), and the results are reviewed here for the first quarter. The blog also examines the aggregated provincial trip data from 2019 to 2023.
Key Findings:
- Transit ridership in 2023 had not recovered to the levels in 2019, but the recovery was well underway.
- Transit ridership in Montreal is more robust than in Toronto - ridership is almost the same in the two CMAs despite Toronto’s much larger population.
- The first quarter’s percent increase over last year in Vancouver ridership lagged the other CMAs due to labour strife in January.
- In the Toronto CMA, TTC ridership exceeds GO Transit by a wide margin. However, GO’s year-over-year percent increase in ridership outpaced the TTC during the first quarter – 36% vs. 11%.
Accolades are extended to StatCan for expanding its coverage of transit statistics. Hopefully, the survey can soon be broadened to include all transit agencies operating in CMAs like Toronto. Additionally, transit is only one transportation mode utilized in moving around a metropolitan area. A big step forward for StatCan would be to survey households and businesses regularly to ascertain all their trips by mode of transportation.
Background
Urban analysts require data to understand how individuals move within urban environments, encompassing various transportation modes such as cars, public transit, walking and cycling. There is no national comprehensive database for urban trips, excluding the Census of Canada data on modes of work trips available every five years.
Since January 2017, StatCan has released passenger counts as part of its Monthly Passenger Bus and Urban Transit Survey. The survey collects total operating revenues and passenger trip data from urban and intercity transit companies across Canada, representing at least 75% of urban transit and intercity bus revenues. Most trips are urban transit trips.
This database was not very useful since it was released only for regions (combinations of provinces): Quebec and Ontario; the Prairies, British Columbia, and the territories; and the Atlantic provinces. This aggregation made it impossible to discern specific transit patterns within a province, let alone individual urban regions.
However, in February of this year, the database significantly improved when StatCan began releasing monthly data for selected urban transit agencies with comparable data for 2023. This development provided more granular insights into transit ridership and trends within different urban areas. At the time of writing, passenger trip data was available for the first three months of 2024 and all months in 2023.
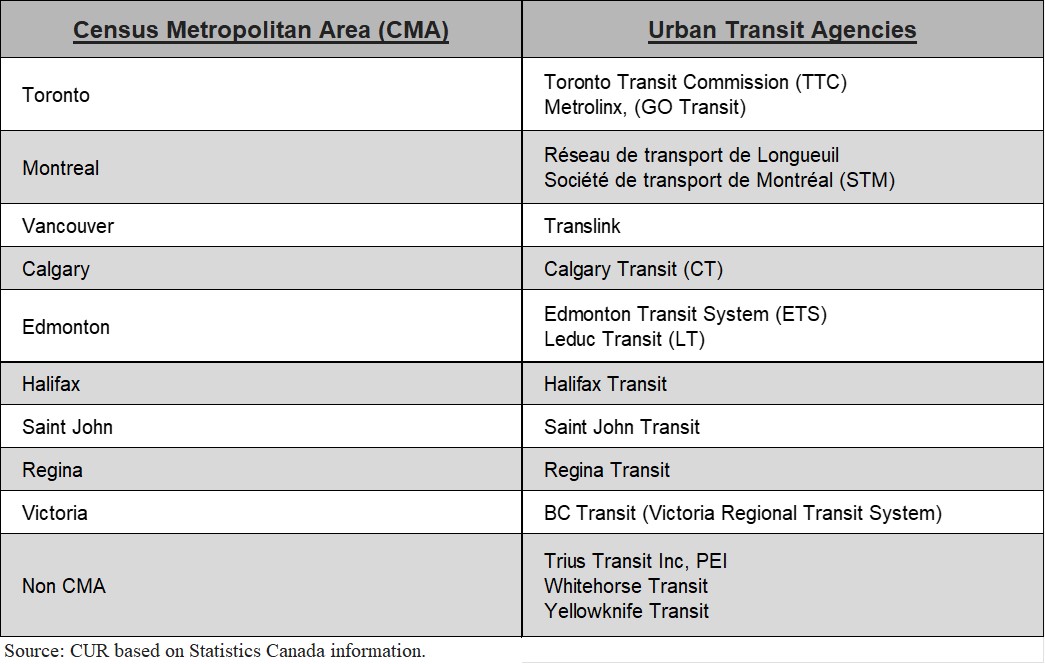
Figure 1 lists the transit agencies surveyed monthly by StatCan, organized by census metropolitan area (CMA) where appropriate. CMAs represent the commutershed where most urban residents live and work.
Figure 1. Urban Transit Agencies Surveyed by Statistics Canada
Passenger Trip Data by Regions 2019-2023
Figure 2 shows public transit usage trends across various Canadian regions over five years, comparing passenger trips (in millions) in the Atlantic provinces, Prairies/British Columbia, and Quebec/Ontario.
Figure 2. Transit Passenger Trips by Combined Provinces, 2019-2023, Trips (Millions)
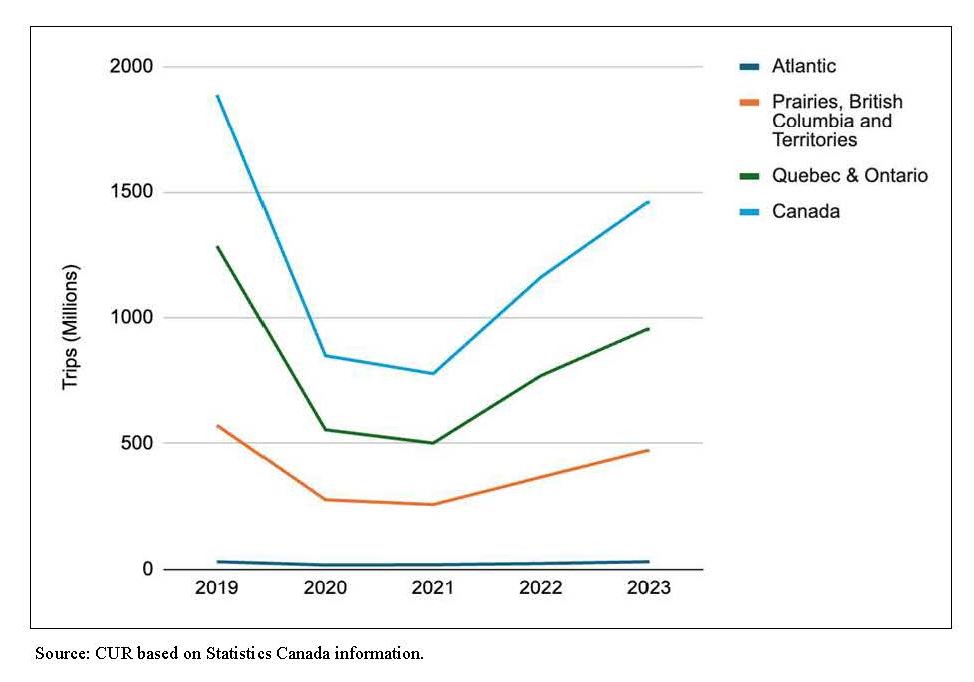
Highlights:
- Ontario/Quebec dominated national transit trips, followed by the Prairies/BC - transit trips in the Atlantic provinces were low in comparison.
- Significant declines in passenger trips occurred across all regions in 2020 due to COVID-19, with low ridership persisting through 2021. Trips recovered in 2022 and 2023 but did not reach prior 2019 volumes.
- The decline in passenger trips in Ontario/Quebec was larger than in western provinces, but the recovery was stronger over 2022-2023.
Passenger Trips by Census Metropolitan Areas (CMAs)
Figure 3 shows transit passenger trips during the first quarter of 2023 and 2024 in five of the nine CMAs covered by the urban transit agencies in the StatCan survey. Halifax and Saint John are excluded due to their small numbers.
Figure 3. Transit Public Passenger Trips, Five CMAs, Jan-Mar 2023 & 2024, Trips (Millions)
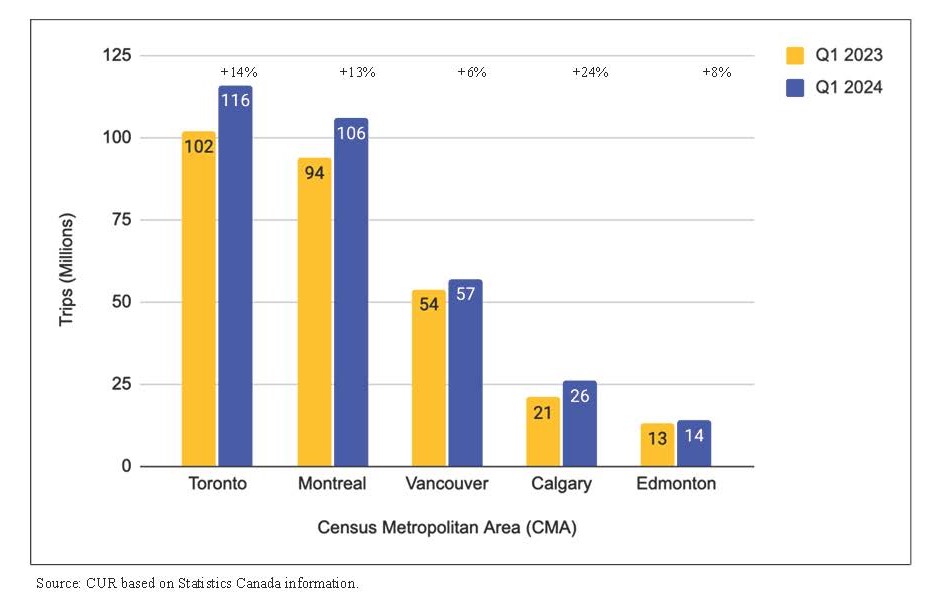
Highlights:
- Montreal’s transit agencies appear to have more robust usage than Toronto’s. The volume of passenger trips was about the same in the two CMAs, despite Toronto having a 2023 population that is 51% larger than Montreal’s.
- Calgary had the largest year-over-year percent increase in passenger trips in the first quarter of 2024 (24%), followed by Toronto (14%), Montreal (13%) and Edmonton (8%).
- In contrast, Vancouver lagged with year-to-year increases of just 6%, but this was temporary, as it was due to labour unrest that halted bus operations in January.
Transit Passenger Trips in the Toronto CMA: TTC and GO
Figure 4 shows the first quarter transit passenger trips in the Toronto CMA in 2023 and 2024 split between the TTC and GO Transit.
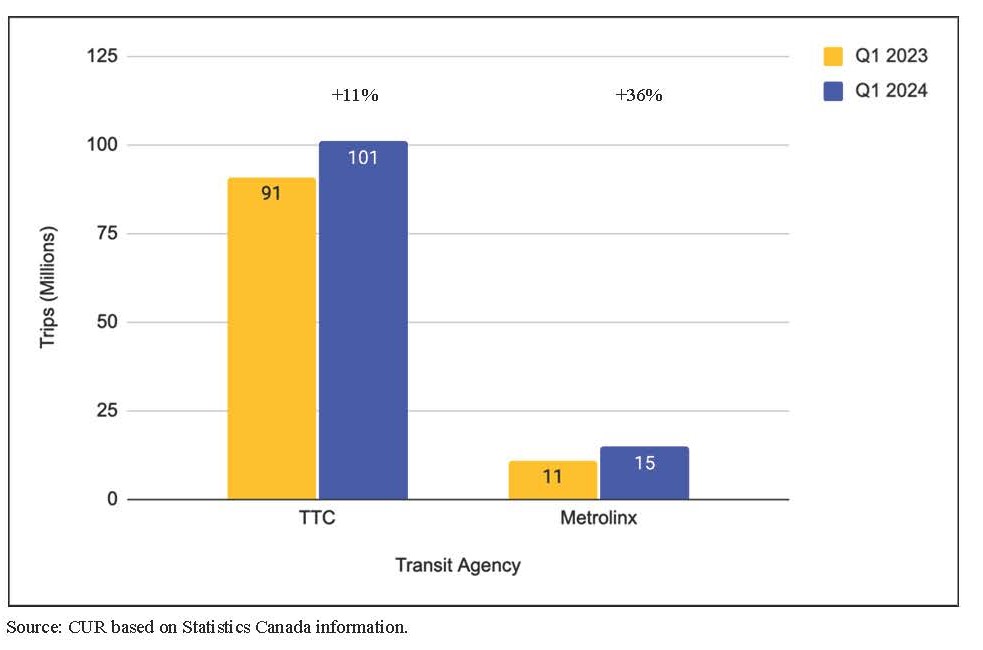
Highlights:
- The TTC dominated transit usage in the Toronto CMA. First-quarter passenger trips on the TTC in 2024 were 6.7 times more than those on the GO.
- However, the percent year-over-year growth was much more robust in GO than the TTC - a 36% increase compared to 11%.
Concluding Comments
Accolades are extended to StatCan for expanding its coverage of transit statistics. Hopefully, the survey can soon be broadened to include all transit agencies operating in CMAs like Toronto.
Additionally, transit is only one mode of transportation utilized in moving around a metropolitan area. A big step forward would be for StatCan to survey households and businesses regularly to ascertain all their trips by mode of transportation.
References
Statistics Canada. Table 17-10-0148-01 Population estimates, July 1, by census metropolitan area and census agglomeration, 2021 boundaries (external link)
Statistics Canada. Table 23-10-0307-01 Passenger bus and urban transit statistics, by Urban transit agency (x 1,000) (external link)
Statistics Canada. Table 23-10-0251-01 Passenger bus and urban transit statistics, by the North American Industry Classification System (NAICS) (x 1,000,000) (external link)
