GGH Population Growth: Population Surges in the City of Toronto, Peel and Waterloo Regions in 2023
By: Frank Clayton, Senior Research Fellow, and Elizabeth Zenko, Research Assistant
June 4, 2024
(PDF file) Print-friendly version available
Background
Statistics Canada (StatCan) released its annual population estimates for subprovincial areas as of July 1, 2023. The estimates for census divisions (CDs) and census metropolitan areas (CMAs) situated within the Greater Golden Horseshoe (GGH) are presented here.
Census divisions include single-tier municipalities (cities of Toronto and Hamilton), regional municipalities (like Peel, Niagara and Halton), and counties including their separated municipalities (the Simcoe county CD incorporates the population of Barrie and Orillia, for example). The blog refers to CDs as municipalities.
CMAs are commutersheds based upon where most of the population live and work. As such, they typically represent housing market areas which individual municipalities usually do not. The latest population figures are subject to revision. The annual population estimates previously released for 2017-2022 have been updated by StatCan to reflect the population results of the 2021 Census of Canada.
The results for the municipalities (CDs) are presented first, followed by the CMAs.
Summary
The GGH's population climbed by an extraordinary 340,000 persons in the 12 months ending July 1, 2023, spurred on by a significant rise in immigration, far more than the growth in any of the preceding six years.
By upper-tier and single-tier municipality (census division):
- Population growth was concentrated in the Greater Toronto Area (GTA) – its 233,000 increase represents over two-thirds of all GGH growth in 2023.
- The city of Toronto (126,000) and Peel region (57,000) dominated growth in the GGH – accounting for almost 80% of GTA growth and nearly 55% of GGH growth in 2023.
- Waterloo region was third in terms of absolute growth (37,000).
- Another five municipalities achieved higher population growth in 2023 than in recent years: Durham region (21,000), Niagara region (17,000), Simcoe county (16,000), city of Hamilton (12,000) and Peterborough county (6,000).
- Looking at a municipality’s share of GGH population growth relative to its share of total population provides a measure of relative growth in 2023. The three dominant growth municipalities, the city of Toronto, Peel and Waterloo regions, are all relatively fast-growing areas. Three municipalities are relatively slower growing: York region, Halton region and the city of Hamilton.
By geographical areas representing commutersheds or housing market areas (the CMAs):
- The Toronto CMA (222,000) dominated, accounting for two-thirds of GGH population growth in 2023;
- Kitchener-Cambridge-Waterloo was the second fastest growth CMA in the GGH, with an increase of 39,000 persons
- Oshawa, St. Catharines-Niagara, Hamilton and Peterborough CMAs had accelerating growth in 2023 from 2022;
The Ontario portion of Ottawa-Gatineau (35,000) was the third fastest-growing CMA in Ontario.
2023 Population Growth: GGH Municipalities
The city of Toronto, Peel and Waterloo regions accounted for nearly two-thirds of GGH population growth in 2023
Figure 1 presents population growth in single- and upper-tier municipalities (CDs) within the GGH by year since the 2016 Census of Canada was conducted. The annual estimates pertain to the 12 months ending July 1 of the indicated years.
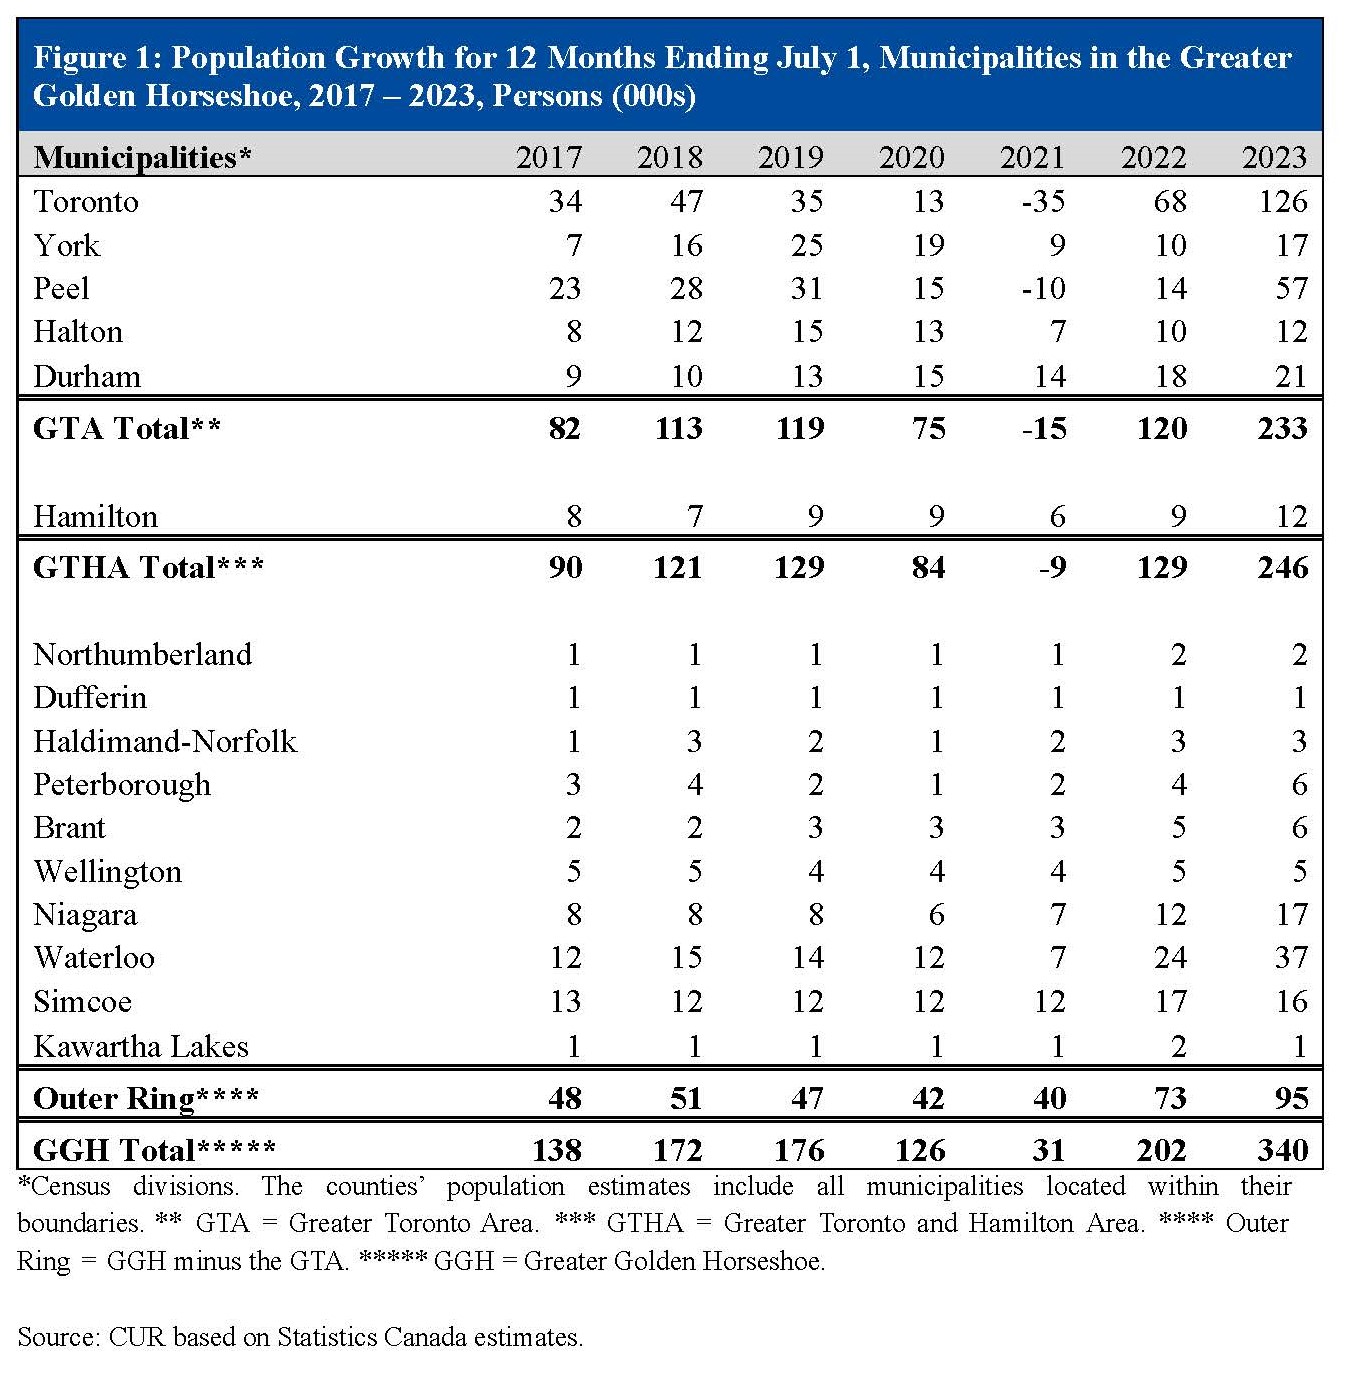
Highlights:
- The GGH’s population growth exploded in 2023, with over two-thirds of the growth occurring in the GTA. The growth of 340,000 persons in 2023 significantly exceeded 2022’s growth of 202,000, which in turn was considerably higher than growth in any of the preceding five years.
- Two-thirds of 2023’s population growth in the GGH occurred in three municipalities – city of Toronto (126,000), Peel region (57,000) and Waterloo region (37,000). Not only are these absolute growth numbers unusually high compared to the previous six years because of the upsurge of immigrants, but they also represent a much higher share of GGH growth than in the recent past.
- Several other municipalities achieved higher growth in 2023 than in recent years. These are Durham region (21,000), Niagara region (17,000), Simcoe county (16,000), city of Hamilton (12,000) and Peterborough county (6,000).
2023 population growth fell short of 2023 GGH total population shares in York and Halton regions and the city of Hamilton
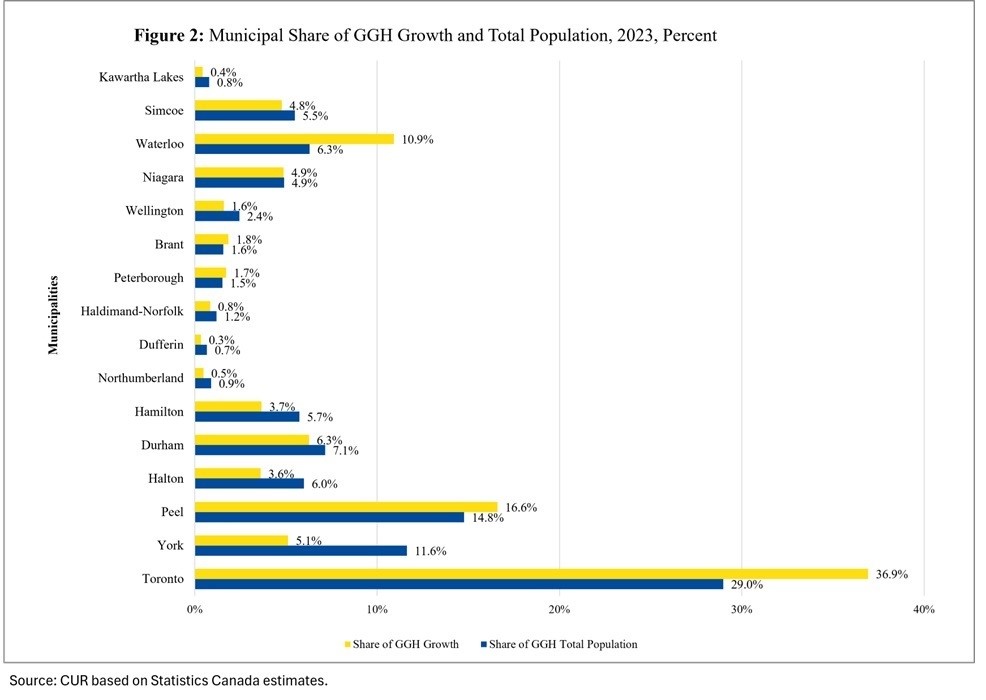
Figure 2 compares each municipality’s share of the GGH’s 2023 population growth with its share of the GGH’s total population in 2023. Municipalities with a growth share above their share of the 2023 total population are labeled as “relatively rapidly growing”. In contrast, municipalities with growth shares below their total population share are “relatively slower growing”.
Highlights:
Three municipalities are categorized as slower growing in the 12 months ending July 1, 2023
York region, Halton region and the city of Hamilton all had shares of GGH-wide growth in 2023 significantly below their share of the GGH’s total population in the same year:
- York region: 5.1% vs 11.6%
- Halton region: 3.6% vs 6.0%
- city of Hamilton: 3.7% vs 5.7%
Simcoe county (includes Barrie, Innisfil), Wellington county (includes Guelph) and Durham region also had growth shares modestly lagging their total population shares:
- Simcoe county: 4.8% vs 5.5%
- Wellington county: 1.6% vs 2.4%
- Durham region: 6.3% vs 7.1%
Given their significant roles in the new housing market, the experience of these municipalities was not what we would have expected.
In contrast, the three dominant growth municipalities, the city of Toronto, Peel and Waterloo regions, have growth shares that sharply outpaced their total population shares:
- city of Toronto: 36.9% vs 29.0%
- Waterloo region: 10.9% vs 6.3%
- Peel region: 16.6% vs 14.8%
2023 Population Growth: CMAs in the GGH
The Toronto CMA, with the Waterloo CMA a distant second, dominated GGH population growth in 2023
Figure 3 presents population growth in the nine CMAs within the GGH for the past seven years (12 months ending July 1 of the indicated years). To compare growth patterns in other parts of the province, data is provided for another five CMAs as well.
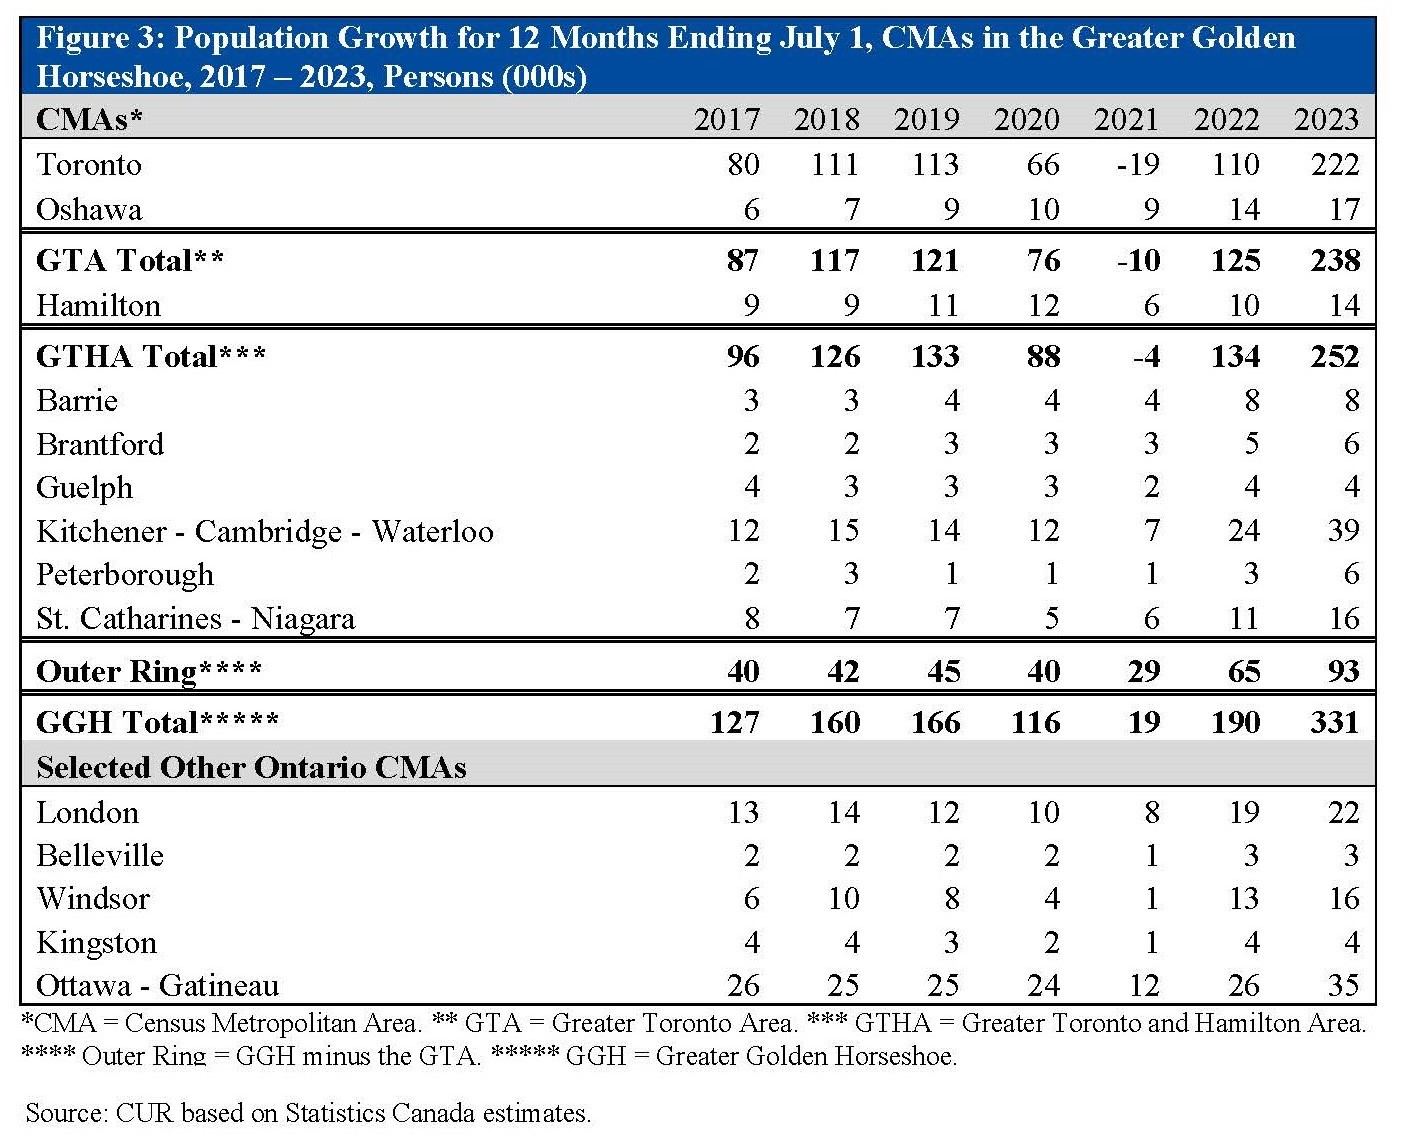
Highlights:
- The dominance of the Toronto CMA is not surprising given the growth dynamics in the city of Toronto and Peel region. The Toronto CMA’s population growth in the 12 months ending July 1, 2023 (222,000) doubled from the preceding 12 months (110,000). The Kitchener-Cambridge-Waterloo CMA also recorded accelerated growth (from 24,000 to 39,000) from a much smaller base.
- The pace of population growth in the remaining CMAs was mixed, with four experiencing relatively rapid growth and three stable growth. Oshawa, St. Catharines-Niagara, Hamilton and Peterborough CMAs had accelerating growth in 2023 from 2022. In contrast, growth was about the same in the two years in Barrie, Brantford and Guelph CMAs.
- For selected Ontario CMAs beyond the GGH, three had accelerating growth in 2023 from 2022, and two were stable. Ottawa, London and Windsor CMAs all experienced population growth in 2023, exceeding the growth in any of the preceding six years, while Kingston and Belleville recorded stable growth.
References
Statistics Canada. Table 17-10-0152-01 Population estimates, July 1, by census division, 2021 Boundaries. https://www150.statcan.gc.ca/t1/tbl1/en/tv.action?pid=1710015201 (external link)
Statistics Canada. Table 17-10-0148-01 Population estimates, July 1, by census metropolitan area and census agglomeration, 2021 Boundaries. https://www150.statcan.gc.ca/t1/tbl1/en/tv.action?pid=1710014801 (external link)
