GDP Growth Rates in Guelph, Kitchener-Cambridge-Waterloo, and Barrie Exceeded the Toronto CMA 2009-2020
By: Frank Clayton, Senior Research Fellow, and Elizabeth Zenko, Research Assistant
May 15, 2024
(PDF file) Print-friendly version available
Executive Summary
Statistics Canada recently released a new dataset estimating Gross Domestic Product (GDP) for Census Metropolitan Areas (CMAs) across Canada. This paper presents the estimates for the CMAs in Ontario.
There are wide variations between Ontario CMAs, including those in the Greater Golden Horseshoe, in terms of their aggregate GDP, GDP per capita, and growth rates in GDP. Highlights include:
- Total GDP in 2020: Toronto dominates, with Ottawa a distant second;
- GDP per capita in 2020: Ottawa, Toronto, and Guelph at top; and
- Growth in GDP, 2009 - 2020: Guelph followed by Kitchener-Cambridge-Waterloo, Barrie and Toronto recorded the highest rates of growth.
What is needed now is an investigation of why these differences exist and the opportunities to enhance economic well-being through raising GDP per capita in all the CMAs.
Background
Statistics Canada (StatCan) recently released estimates of Gross Domestic Product (GDP) by Census Metropolitan Area (CMA) across Canada for 2009 - 2020. GDP measures the size and performance of an economy – the total output created through the production of goods and services. A CMA is a commutershed that includes a core municipality and adjacent municipalities based on commuting patterns.
The estimates are for total GDP only. Unlike for national and provincial estimates, no details of the components of GDP have been released for CMAs. Still, it is useful to examine the estimates to ascertain the economic performance of CMAs as a starting point for further analysis.
This blog highlights this dataset for all 15 CMAs in Ontario.[1] Nine of the CMAs are part of the Greater Golden Horseshoe (GGH).[2] The variables that are analyzed are:
- Total GDP in the most recent year (2020);
- Per capita GDP in 2020; and
- GDP growth between 2009 and 2020.
Total GDP in 2020: Toronto dominates, with Ottawa a distant second
Figure 1 presents the 2020 GDP for Ontario CMAs ordered by the size of their GDP. The GDP for the parts of the province outside the CMAs is also shown. The 15 CMAs accounted for 87% of the province’s GDP.[3]
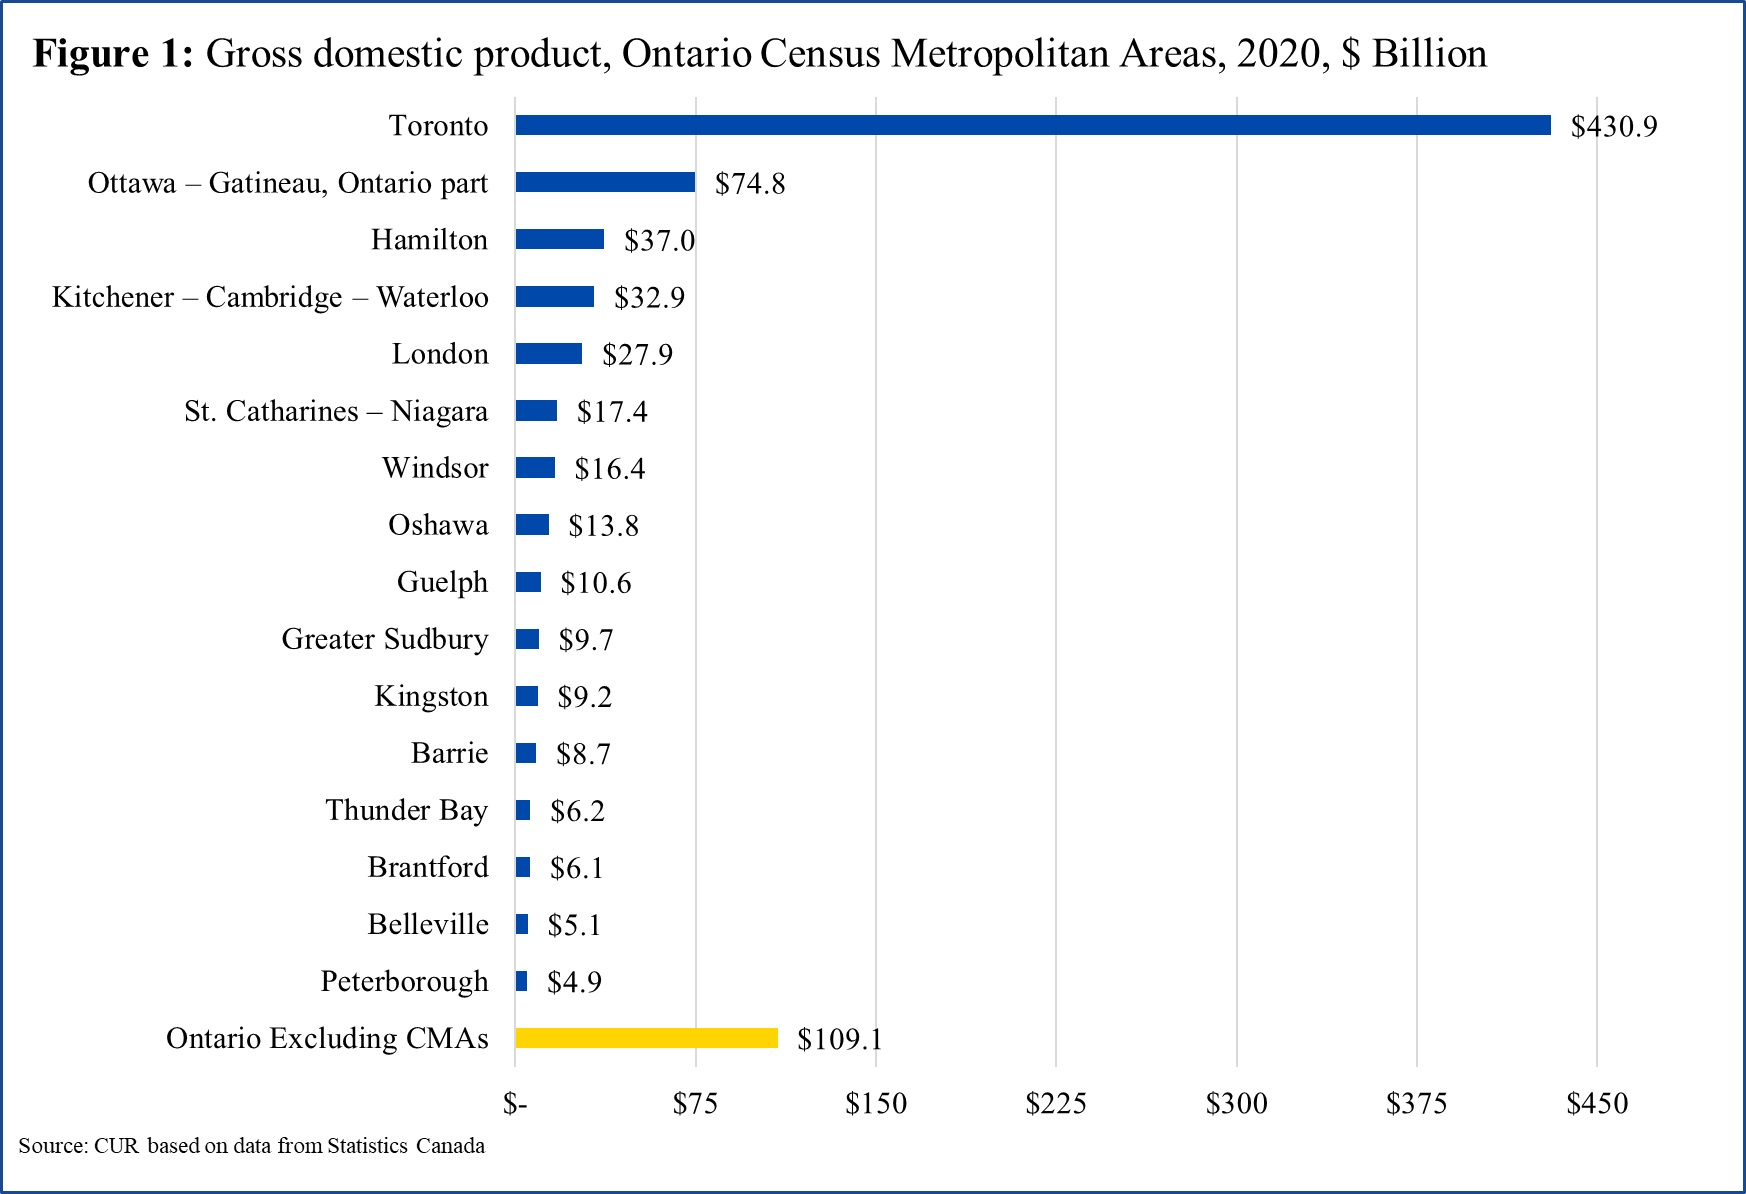
Highlights:
- Toronto is the far more dominant CMA with a 2020 GDP of $430.9 billion, five times the GDP of the closest CMA, Ottawa, at $74.8 billion;
- Toronto’s GDP was larger than all other CMAs combined ($280.9 billion) and accounted for 52% of Ontario’s GDP in 2020; and
- The Ontario portion of the Ottawa-Gatineau CMA’s GDP was larger than the combined CMAs of Hamilton and Kitchener-Cambridge-Waterloo.[4]
GDP per capita in 2020: Ottawa, Toronto, and Guelph at the top
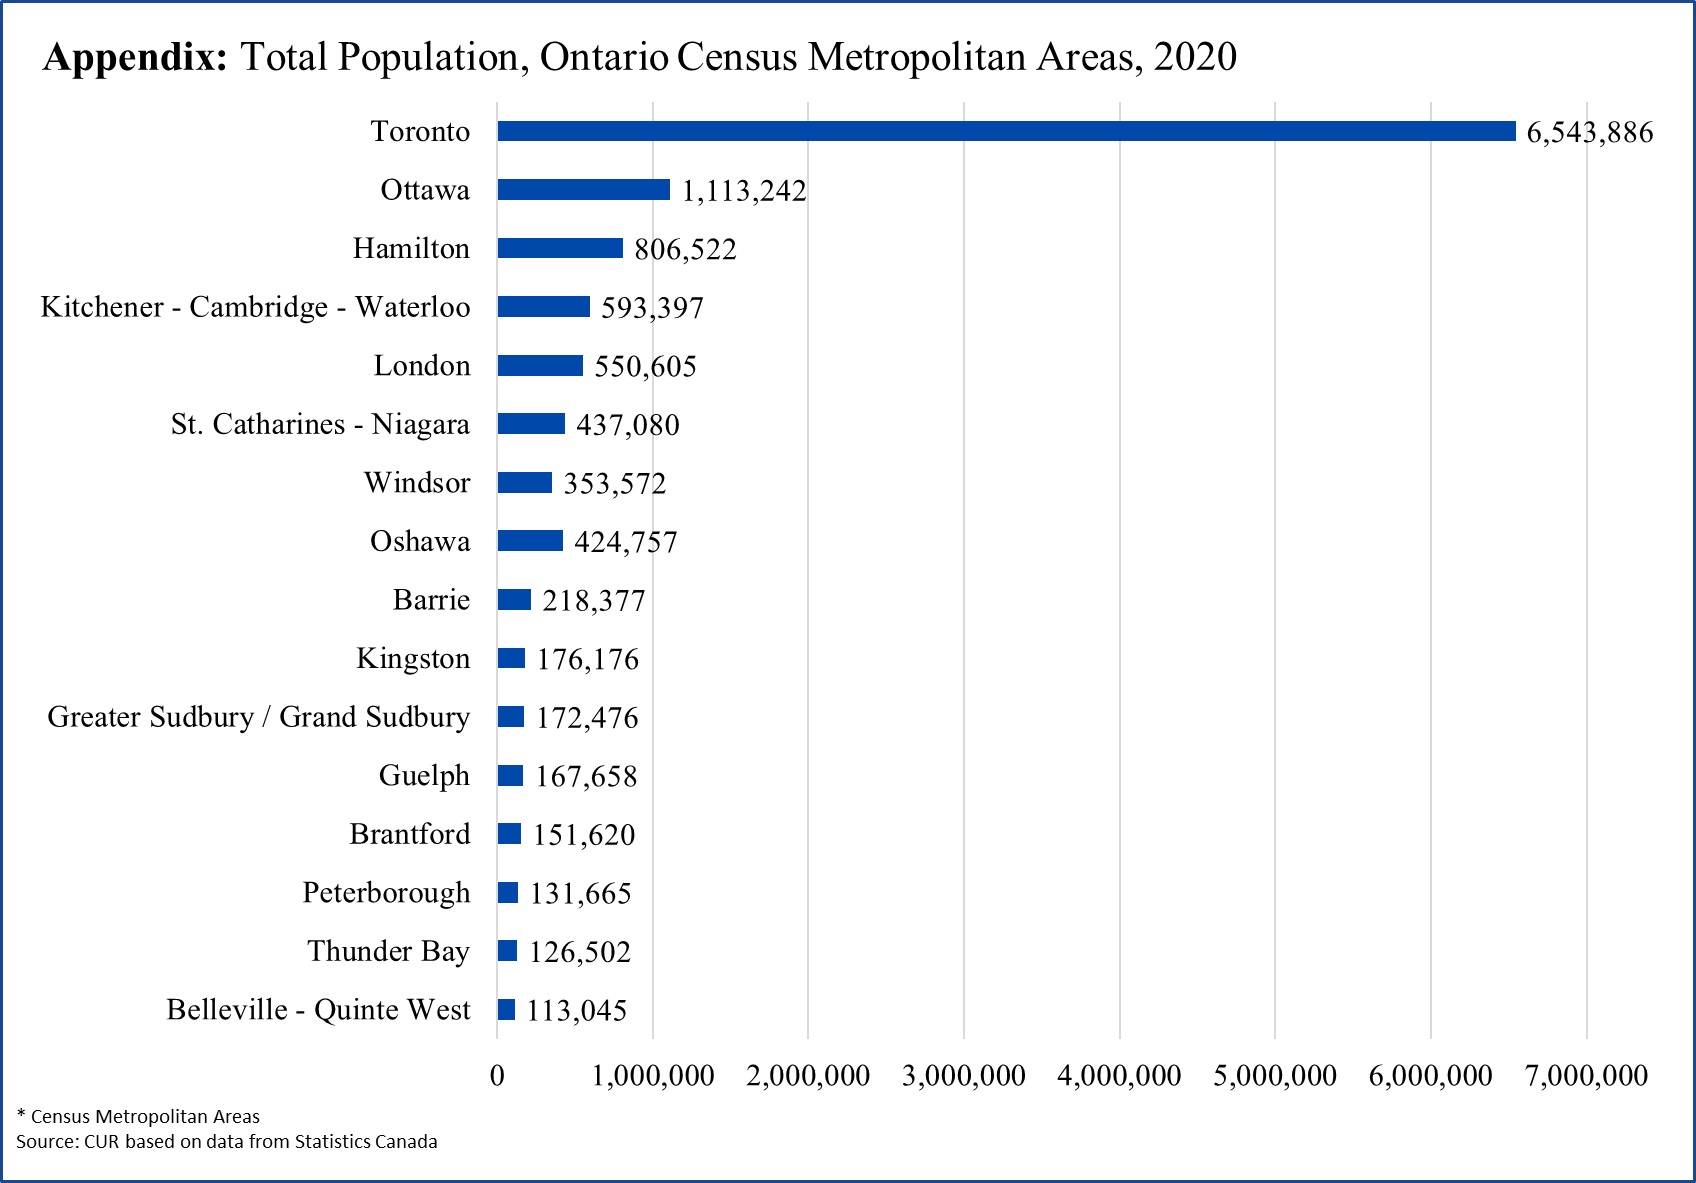
Figure 2 presents the GDP per capita for Ontario CMAs and for Ontario excluding CMAs. The 2020 population estimates released by StatCan in early 2022 are utilized to create the per capita estimates. The ranking of CMAs by their total population is contained in an appendix table.[5]
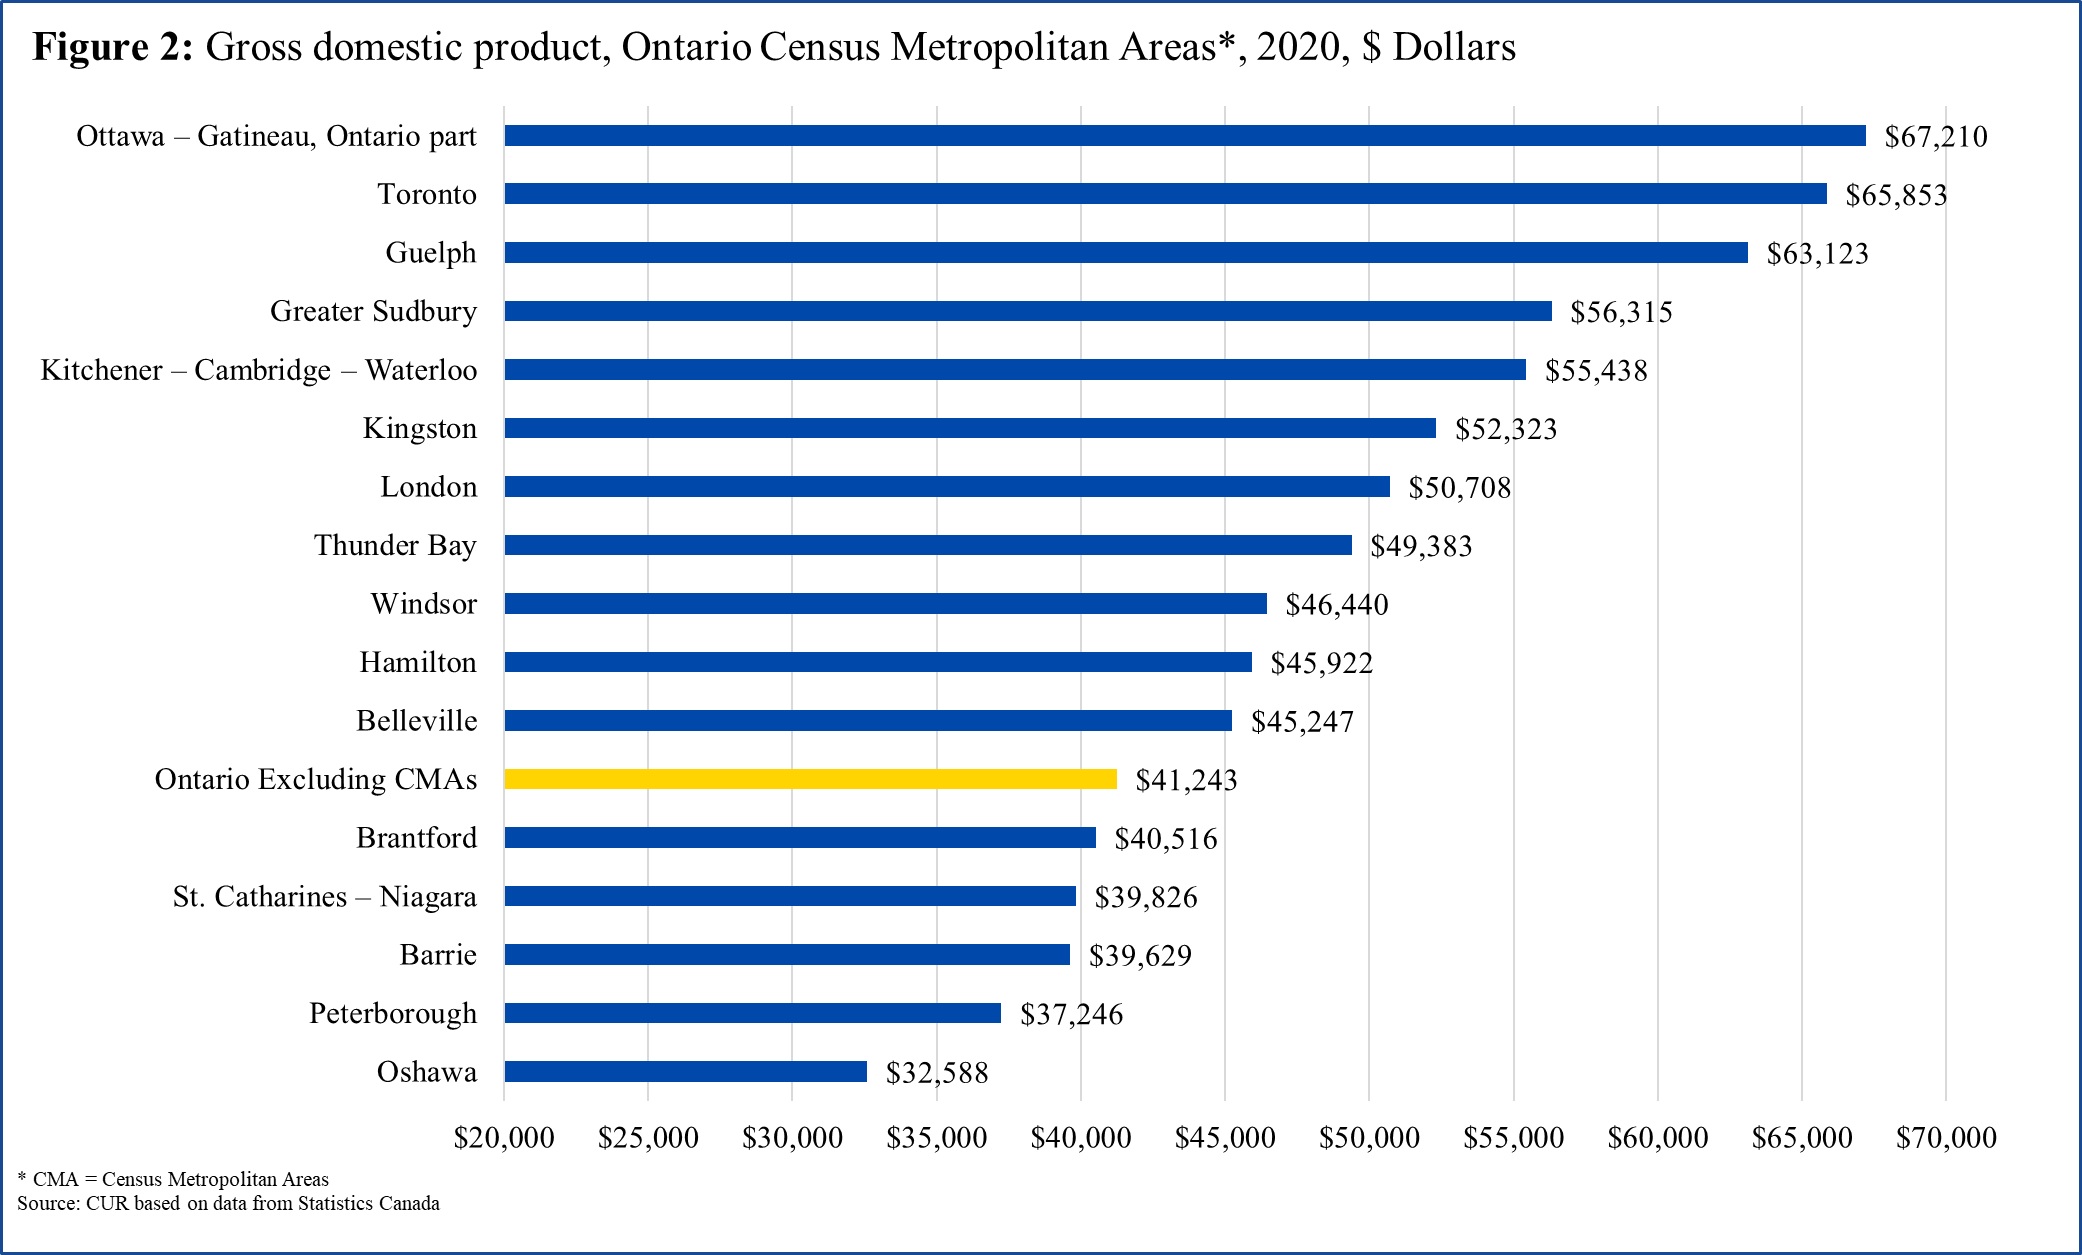
Highlights:
- There is marked variation in the per capita GDP by CMA ranging from a high of $67,210 in Ottawa, to a low of $32,588 in Oshawa, a difference of about 50%;
- The CMAs with the largest GDP per capita were Ottawa, Toronto, and Guelph at $63,123 or higher; and
- The five CMAs with the lowest GDP per capita were Oshawa, Peterborough, Barrie, St. Catharines-Niagara, and Brantford at $40,516 or lower.
There is a correlation between GDP and population, with the larger CMAs having larger GDP than smaller CMAs. This can be seen from a comparison of Figure 2 and the appendix table. The eight CMAs with the largest populations also have the higher GDP per capita.
A CMA’s GDP per capita is also influenced by the extent to which the CMA has net in- or out-commuting of labour.
Growth in GDP, 2009 - 2020: Guelph, followed by Kitchener-Cambridge-Waterloo, Barrie, and Toronto, recorded the highest rates of growth
Figure 3 shows the growth in GDP in the Ontario CMAs for 2009-2020, the period covered by the StatCan estimates.
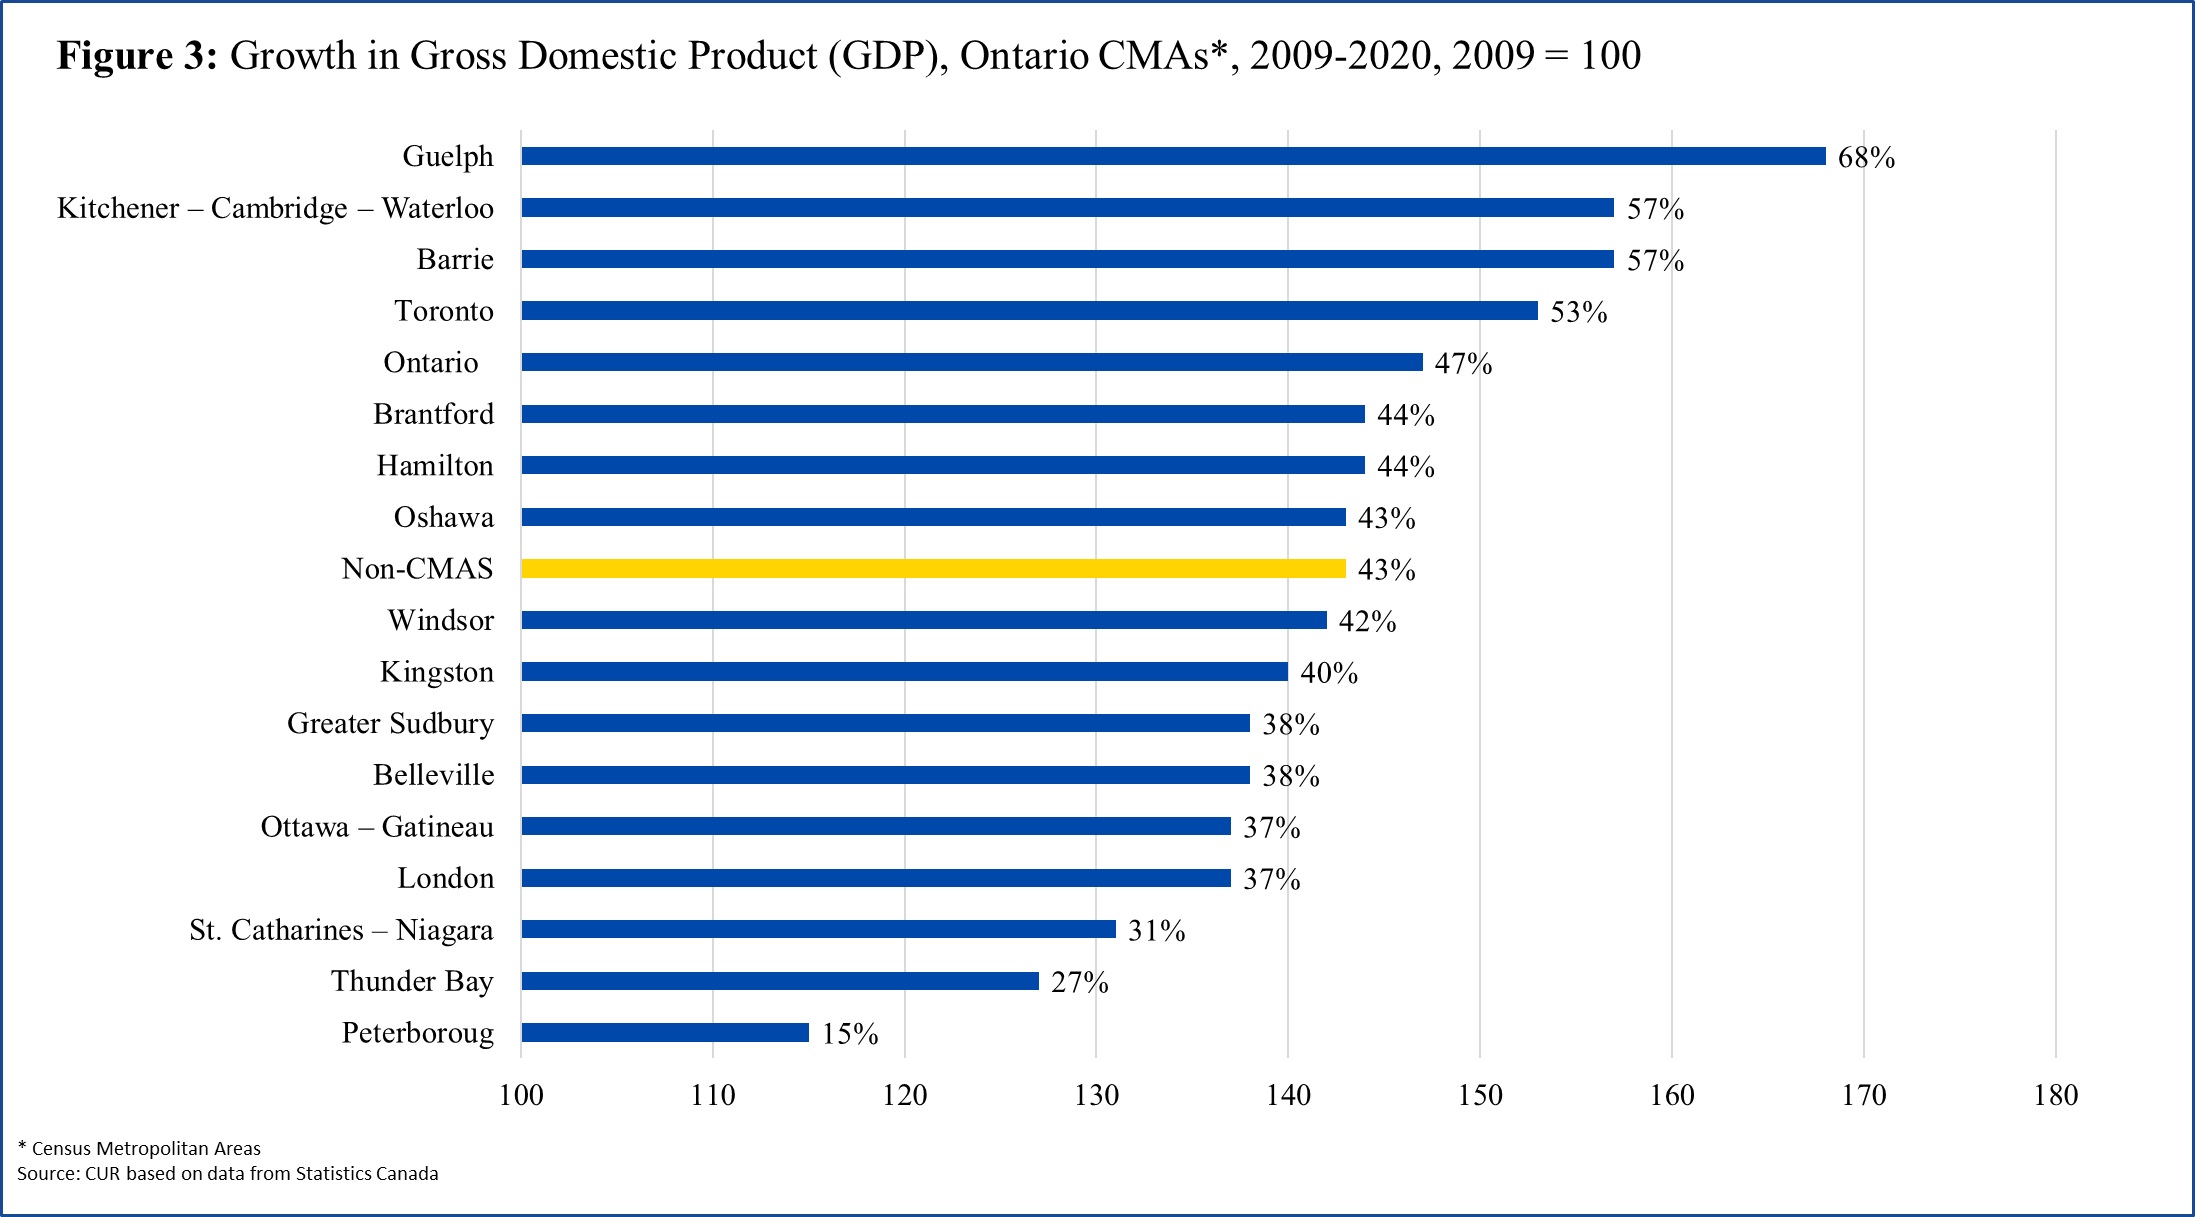
Highlights:
- Guelph had a stellar rate of growth in its GDP - 68%;
- Kitchener-Cambridge-Waterloo, Barrie, and Toronto followed Guelph with the pace of growth exceeding 53%; and
- The CMAs with the smallest growth rates were Peterborough, Thunder Bay, and St. Catharines Niagara (31% or less).
Conclusions
There are wide variations between Ontario CMAs (including those in the Greater Golden Horseshoe) in terms of their aggregate GDP, GDP per capita and growth rates in GDP. What is needed now is an investigation of why these differences exist and the opportunities to enhance economic well-being through raising GDP per capita in all the CMAs.
Endnotes
[1] Ottawa CMA excludes the Gatineau portion of the Ottawa-Gatineau CMA
[2] The GGH consists of Peterborough, St. Catherines-Niagara, Oshawa, Hamilton, Brantford, Toronto, Barrie, Kitchener-Cambridge-Waterloo, and Guelph
[3] GDP for the province in 2020 was $821 billion
[4] Ottawa-Gatineau (Ontario part) contributed 83% to the total Ottawa-Gatineau CMA’s GDP in 2020 ($89.9 billion).
[5] These estimates are expected to be revised when StatCan releases updated postcensal population estimates in May 2024.
References
Statistics Canada. (2023). Table 36-10-0468-01 Gross domestic product (GDP) at basic prices, by census metropolitan area (CMA) (x 1,000,000). https://doi.org/10.25318/3610046801-eng (external link)
Statistics Canada. Table 17-10-0135-01 Population estimates, July 1, by census metropolitan area and census agglomeration, 2016 boundaries (external link) . https://doi.org/10.25318/1710013501-eng (external link)
Appendix